If you want to be kept up to date with new articles, CSS resources and tools, join our newsletter.
Web Vitals are a set of measurements that gauge the user experience of your website. If you score poorly on them, your site is not as nice to use as a site with good Core Web Vitals. Google also uses them to determine the SEO score of a page. So improving them is important for any website.
What are the Core Web Vitals?
While there are seven different Web Vitals, the Core Web Vitals are the three that have the largest impact:
CLS: Cumulative Layout Shift
This measures how much your layout changes as the page loads, or as a user interacts with your page. Things like images loading and pushing content down, or web fonts loading and causing your type to change will change the layout of your page which can be frustrating to your visitors.
You want your CLS to be below 0.1 to get a "Good" score.
FID: First Input Delay
This measures how soon your page is interactive by checking how fast your site responds to the first interaction a user has with your page. While your page is loading it's too busy to process the event and only processes that after the loading is done.
You want your FID to be below 100ms to get a "Good" score.
LCP: Largest Contentful Paint
This measures how long it takes your page to load visually. The Largest Contentful Paint is measured in the time it takes for the last largest visual element to load. This doesn't have to be the visually largest element visible, or even the largest image. It can also be a block of text with a web font.
You want your LCP to be below 2.5 seconds to get a "Good" score.
Out of these three, CLS and LCP are influenced mostly by your page styling (and the way that is loaded) while FID essentially measures how much JS you execute on load.
The other Web Vitals are FCP (First Contentful Paint), TTFB (Time To First Byte), TBT (Total Blocking Time) and TTI (Time To Interactive). This list will probably be expanded with Web Vitals that measure animation performance and overall responsiveness.
Monitoring your core web vitals
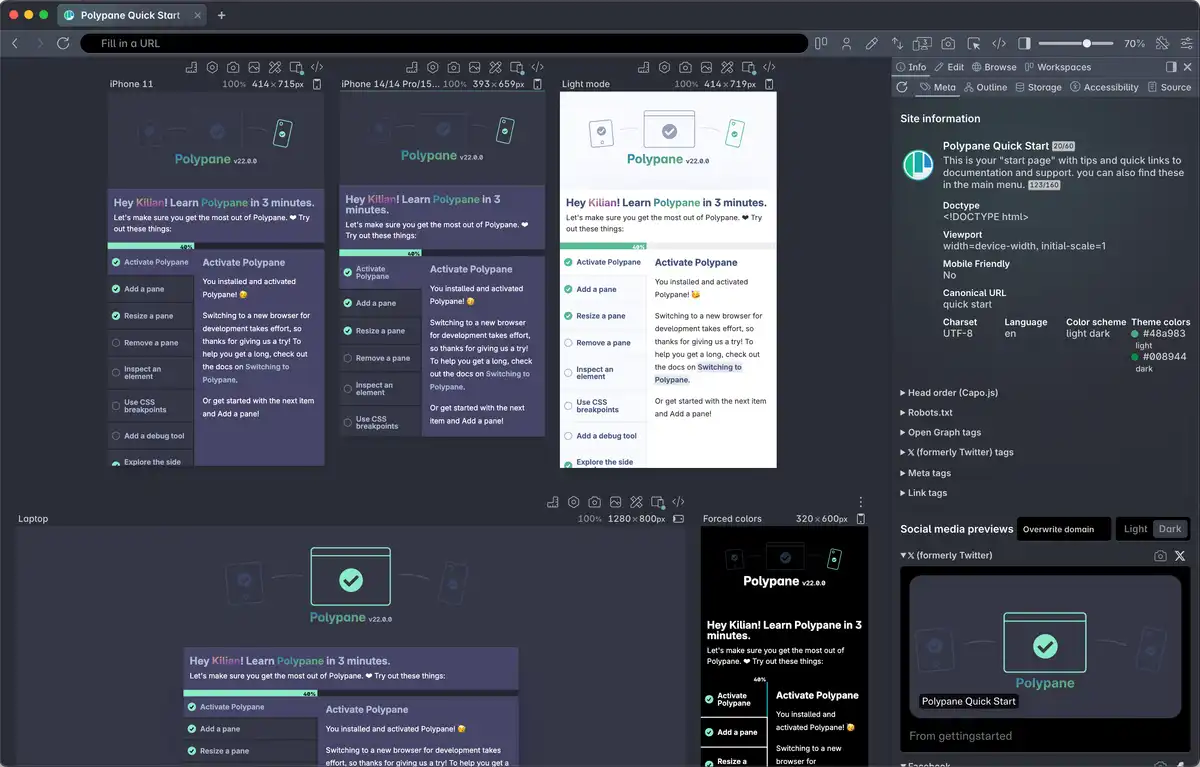
To improve something you first need to measure it. Polypane continuously monitors the web vitals in each pane, but to not clutter the interface your score is hidden until you decide to show it.
Click the settings icon in the top right of Polypane and then toggle "Web Vitals status" to turn web vitals on.
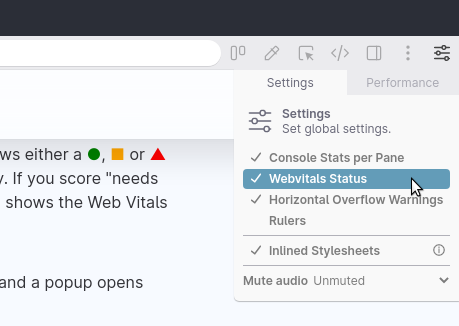
With web vitals turned on each pane gets a new label that shows either a ●, ■ or ▲ for a "good", "needs improvement" or "poor" score respectively. If you score "needs improvement" or "poor" on any of the web vitals, the label also shows the Web Vitals that score "poor" or "needs improvement".
To get more detailed information you can hover over the label and a popup opens with a full overview of your Web Vitals. Along with the Core Web Vitals, Polypane also shows you the First Contentful Paint score and Time To First Byte.
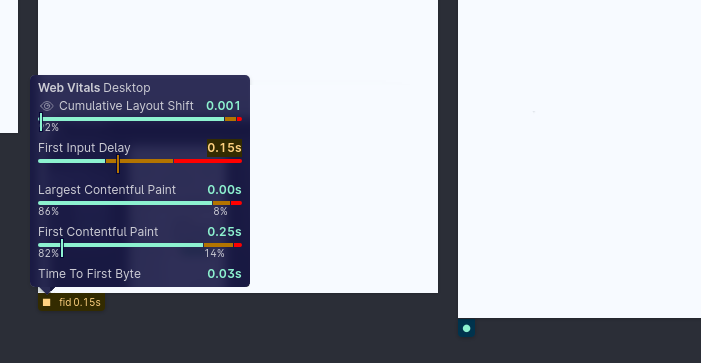
This gives you a more detailed overview of your web vitals score. For any public page you'll notice a bunch of bars here along with the score you get for each web vital.
Those bars show you the average scoring for your page, from the CrUX Field Data that Google collects for all sites. Field Data tells you the average loading experience in the real world. The larger the green part of the bars for CLS and LCP are, the more people your page loads fast for. The CrUX Field Data is measured separately for mobile and desktop, and Polypane will automatically switch between those depending on the size of your pane.
Why CrUX data is useful
Web Vitals are non-deterministic so it's important to look at the averages. Your Web Vitals score will be different on each device, but also different each time your reload your page. Sometimes the network might be a little bit slower, or your CPU might be doing something difficult right as your page is also being parsed, resulting in a worse Web Vitals score.
By showing the averages you can quickly check if your experience compares to the majority of people loading your page, and if the majority of your visitors have a good experience.
Improving CLS and LCP
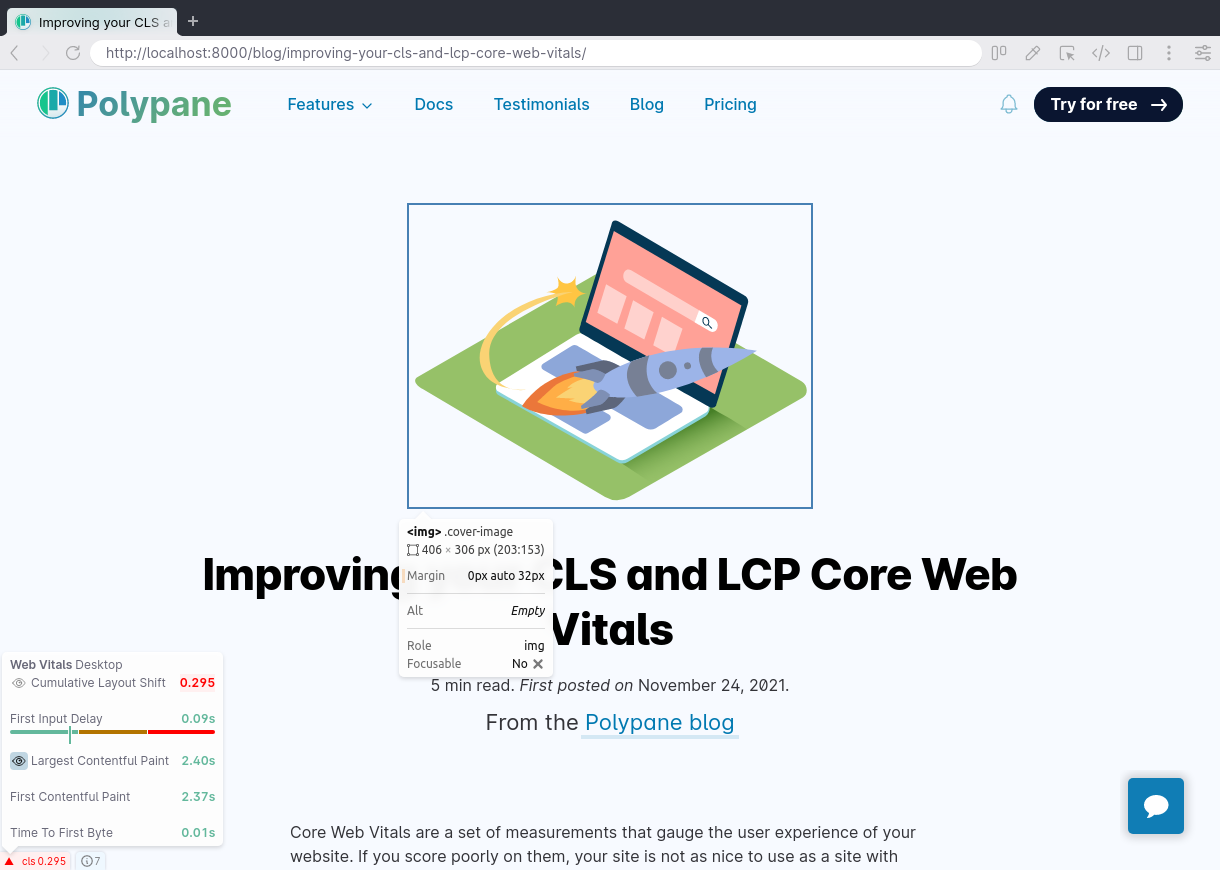
Polypane offers visualizations for both the CLS and LCP so you can figure out exactly which elements contribute to a score and improve them one by one. For example on this page the LCP is the image at the top of the page and it has a score of 1.9s, which is "good".
When a visualization is available there will be an Eye icon visible in the popup next to the Web Vital. Click it to toggle the visualization.
Cumulative Layout Shift
The Cumulative Layout Shift visualization will show you how all the elements that contribute to the layout shift behaved from their initial point of rendering (semitransparent red rectangle with a dashed red border) to their ending position (transparent rectangle with a solid red border).
The bigger the change between the first and second rectangle, the higher your CLS score. For each of these types of elements you can improve your score by doing the following:
Images (and video) could be loaded in too late, in which case you want to add the
loading="eager"andimportance="high"attributes to tell the browser to start loading these early.
Images can also be missing an aspect ratio or width and height attributes. When you add these the browser can already calculate the space an image will take before the image has loaded, so that wont cause a layout shift.
Also make sure that any hero images you have are preloaded at the top of the page using<link rel="preload" href="your-file.jpg" />.Text elements that result in a layout shift are usually caused by your webfont taking too long to load and the elements to first be rendered in the fallback font, then rendered again in the webfont. If your webfont is not important, switch your @font-face declaration from
display: swap;todisplay: optional;. This will give your web font a very small window to load (fast enough to not trigger a layout shift) or the browser will keep the fallback font and won't update to the new font.
You should also make sure to preload your font-files by adding them aspreloadlinks in the header. This will tell your browsers that you're going to use this font, and the browser will download it in advance.
There are also techniques to configure your fallback font using CSS Font Descriptors to make sure that there is no change in the layout when swapping the fonts. Making sure that works well with fallback fonts on all operating systems is impossible though, so we wont recommend it.Elements loaded in through JS are more difficult. When you can, make sure to reserve the space your content will take up (even if it's an estimate) to minimize the layout changing.
Keep in mind that multiple reloads of your page might show you different cumulative layout shift scores, and that different screen sizes will get different elements contributing to the CLS. So make sure to check multiple reloads and multiple screen sizes. In Polypane, you can do that both at the same time by using multiple panes.
Even if you have a very low CLS the visualization can still show elements causing a CLS. You dont have to improve these, but because the shifts might be small they could be easy to fix.
Largest Contentful Paint
The LCP visualization will highlight the element that causes the LCP. If your LCP is low or in the green then this is just for your information, there is nothing to do or to improve. But if your LCP is too high, in the orange or in the red, there's things you can do to improve.
In general, make sure that your site loads as fast as possible. For this you can also use the Time To First Byte measurement in the Web Vitals tooltip, which tells you how long it takes for the first bytes to load after you requested the page. In essence, how long it take your server to respond. If this takes very long it means your server is taking a long time to generate the page.
There's many ways to make your server faster but that's a little out-of-scope for this article. Still, that will have the biggest effect on your LCP.
It's not just how fast your server responds with the HTML, but also all the other resources that need to get downloaded. For a good LCP you need to make sure that the CSS, webfonts and images that are required for your page load are downloaded as fast as possible.
To do this you can make the same improvements as for CLS: Add a loading="eager" and importance="high" to your LCP image and make sure to preload that image in your <head> using <link rel="preload" href="your-file.jpg" />. You should also do this when your LCP element has a large background image.
If your LCP is a text block with a web font, make sure to preload that webfont as well: <link rel="preload" href="your-font.woff2" />.
And if the load of your page depends on third party code, like Google Analytics, you can preconnect and dns-prefetch the domains they're on to get a faster response:
<link rel="preconnect" href="https://googleanalytics.com/" />
<link rel="dns-prefetch" href="https://googleanalytics.com/" />
This way your browser already knows you're going to connect to these domains and it can do the DNS lookup and connection before the request.
Just knowing your Core Web Vitals score doesn't help you figure out what parts of your page to improve, but with the visualizations in Polypane the elements you should focus on become instantly clear. Check out your Core Web Vitals by starting a free Polypane trial.