Table of contents
Skip table of contentsIf you want to be kept up to date with new articles, CSS resources and tools, join our newsletter.
Polypane 9 ships with a completely new way of making and editing screenshots, support for different types of structured data in the Meta panel, new debug tools and many improvements to the outline and elements panel as well as performance improvements, and it now runs on Chromium 102.
New Screenshot feature
The Pane screenshots feature has been completely rewritten to solve two of our most requested improvements:
- Faster screenshots,
- Including edits made to the page, the focus order overlay and debug tool info in the screenshots.
By screenshotting the actual panes instead of using a background renderer, we now do both! This means you can quickly make a screenshot showing for example the elements with contrast issues to send that along to your team or add to a ticket.
Editing screenshots
When you have made a screenshot, often you'll want to quickly edit it. Like redacting sensitive info, adding a rectangle around the area of interest or drawing a few arrows and add some text to explain the issue. Or maybe you want to clip the image to the area you care about.
All of that is now possible in the new amazing screenshot editor powered by Pintura!
This video hasn't been sped up. It's really that fast!
When you're done with the image, you can save the image to disk (in the last used folder, or in a folder of your choice) or copy to clipboard. Once you've saved the image, click the notification and the folder where you saved the image is opened.

This really, really speeds up creating and sharing screenshots (copy to clipboard, paste them in Slack, done) and we can't wait to see what it'll do for your productivity.
Element panel updates
This release we worked on the tree view, making it more interactive and displaying more info in it. The panel now also has autosuggestions for all CSS properties and HTML and ARIA attributes with live preview across all panes.
Tree view updates
When you inspect elements on the page, the treeview now highlights the element so you can see where in the DOM you are.
Hidden elements are now slightly dimmed to differentiate them, and hovering over them no longer shows a tooltip in the panes.
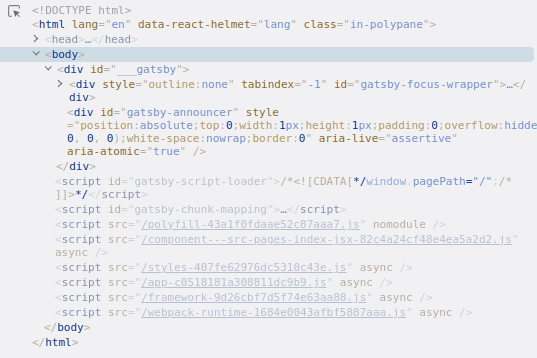
And when elements have a flex or grid layout, that is displayed as a badge so you can quickly see what element is responsible for the layout:
Autosuggestions with live previews
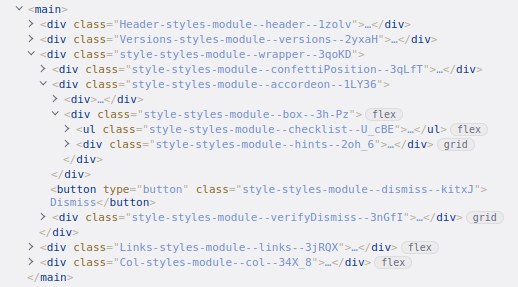
Polypane now also shows autosuggestions for CSS values and HTML and ARIA attributes. When navigating through these in the autosuggestion dropdown they get automatically applied so you can quickly preview them:
This live preview also works for HTML and ARIA attributes so you can quickly see what effect those have as well.
We spent quite a lot of time making sure we have the most complete list of CSS values, HTML and ARIA attributes, even for new and vendor-specific properties. Polypane will suggest more valid values than other browsers.
Structured data in Meta panel
The Meta panel now shows any structured available on the page: JSON-LD, Microdata and RDF. The data is sorted by type and richly displayed where possible, meaning we automatically detect links, images and arrays and display them accordingly. When an image fails to load a warning is shown, so you can see at a glance if there's any issues you need to remedy.
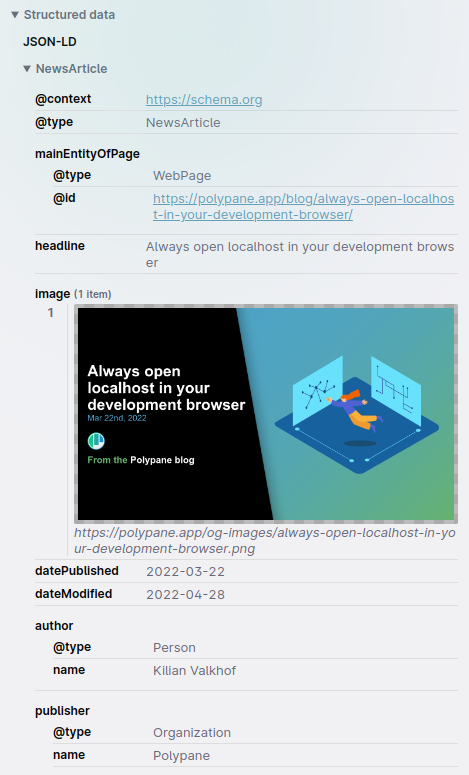
Structured data is important for anyone doing SEO to make sure all the pages are assigned the right entity (so search engines know e.g. which products a page is selling, or the specific metadata for inclusion in the news tabs). With the new structured data overview, you can quickly see anything you might have overlooked.
Mobile friendly tester
Also new in the Meta panel is a new "Mobile friendly" check:
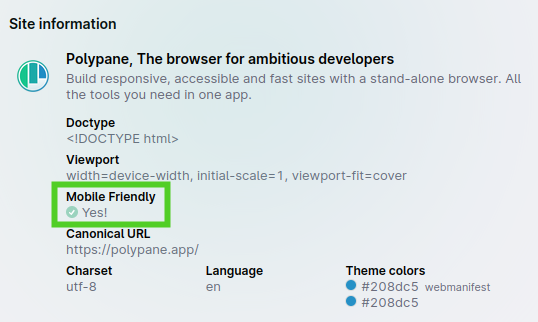
This check follows the guidelines provided by Google and Bing in determining if a page is mobile friendly:
- Has a viewport meta tag.
- Has
width=device-widthin the meta tag. - At least 60% of the text on the page is larger than 12px.
- There are no overlapping tap targets within an area of 48 by 48 pixels.
These checks are done on-the-fly as the meta data is gathered and will result in either a checkmark, or a list of issues to fix:
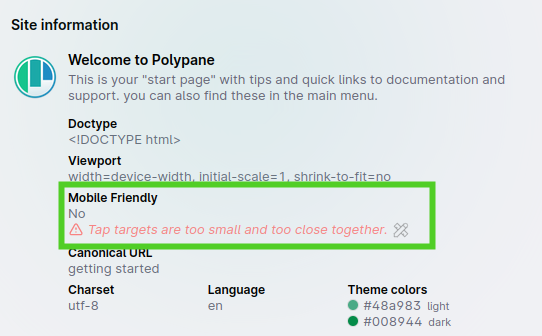
Issues show a button that turns on the appropriate debug tool to detect elements with small text (which was already available in Polypane) or with too small tap targets. This way finding the elements you need to fix takes just a single click.
Find small tap targets with Target Size debug tool
In earlier versions of Polypane the Target Size debug tool changed your cursor into a 48 by 48 square so you could manually check distances around links.
In Polypane 9 this debug tool has been expanded with a tool that analyses all interactive elements on your page to make sure there's at least an area of 48 by 48 pixels around each element. We use the same logic as Google Lighthouse to calculate this.
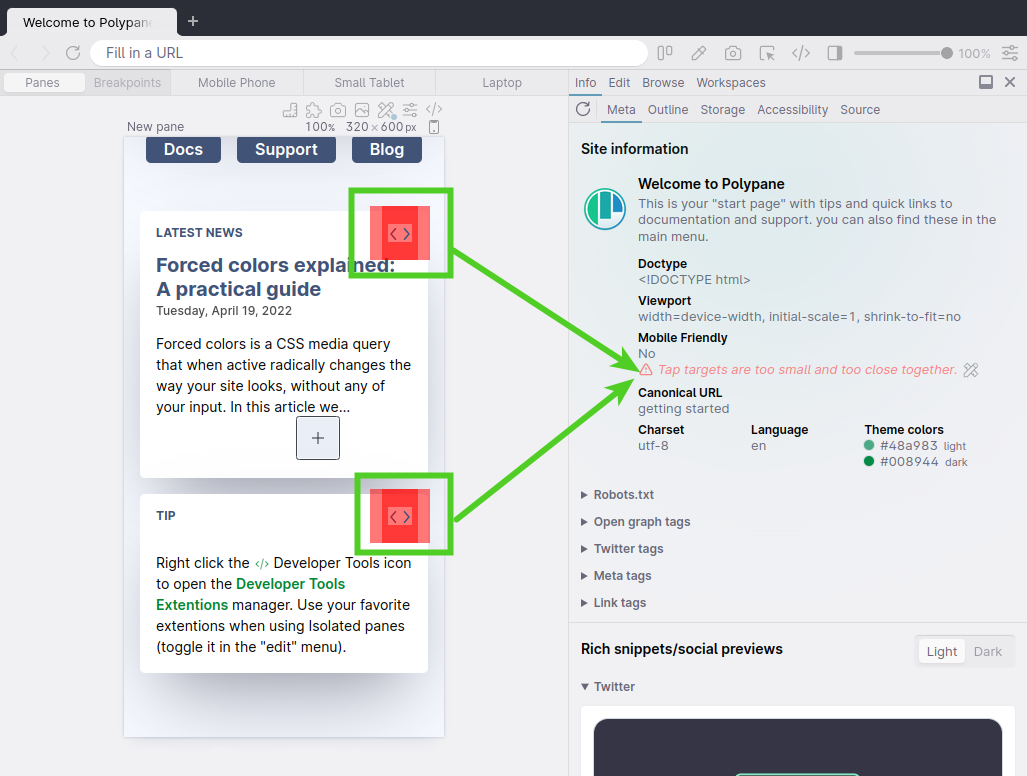
Elements that are too small and too close together now get a red semitransparent border around them indicating the needed space, and to fix the issue you need to make sure the red borders of two elements no longer overlap.
Track focus debug tool
With the Track Focus debug tool turned on, you get a visual highlight of the current focused element that follows the focus as you tab from element to element.
The focus order overlay shows you this information as well, but because the Track focus debug tool is dynamic it's better in handling things like focus traps and interactive pages.
You can combine it with the focus sync option (right click the sync button in the address bar to activate that) like in the video below to check focus across multiple screen sizes in one go.
In-page zoom and search
With the removal of the Legacy mode we we able to add two "regular" browser features that a lot of users have asked for: page zoom and in-page search.
In-page zoom
Page zooming is an important part of Accessibility audits, for various WCAG success criteria your page needs to be able to zoom to 200% or to 400% and now that's possible in Polypane with ctrl/cmd alt +/-, or with the "Zoom web pages" option in the View menu.
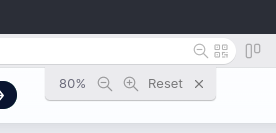
After zooming a page a magnifier with either a plus or minus will be visible in the address bar, and clicking that opens a UI that lets you zoom in, out or reset back to 100% again. Due to the way Chromium internals work that doesn't work per pane, but per origin, so zooming in happens in all panes and is remembered for each origin.
In-page search
With ctrl/cmd f you can now search in all panes. All occurences of your search term are highlighted in yellow with the current matched search term in orange. You can also see where on the page matches are found in the scrollbar.
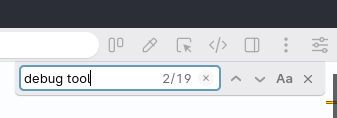
You can navigate through the search terms with the arrow buttons and toggle case sensitivity. Finally pressing esc clears the UI and search.
Outline panel updates
We have a few updates in the outline panel to provide more information and useful warnings. And when you hover over an element in the panel, we now smoothly scroll to the element in each pane.
Links overview
In the links overview, we now highlight the current page (and suggest adding aria-current when missing) and give warnings for placeholder values like "http://" or "mailto://" so you don't forget to fill them.

Images overview
The image overview now warns you about broken images, supports the fetchpriority attribute and will highlight when an image is inside a link, because that will influence what the alt text should say.

Focus order overview
The focus order overview now shows the name of inputs and textareas instead of the content (which is usually empty). This will help you more quickly find the elements.
Performance improvements
We refactored a large part of the Elements panel logic to deal with websites that use a lot of CSS Custom Properties, essentially removing the performance overhead we had for Custom Properties. The result is that Polypane will feel as fast on modern sites with lots of CSS Custom properties as it does on simple pages.
Smaller updates
For all the changes there is the changelog, but there's a few small updates we wanted to highlight:
color-scheme support
The color-scheme meta attribute and CSS property can tell your browser if your site supports dark mode, light mode or both. When set your browser will automatically switch from the regular dark-on-light to a light-on-dark theme depending on if you tell it you only support dark mode, or if you support both and the prefers-color-scheme: dark media query matches. It does this without you writing a single line of CSS, which is pretty cool!
If you want to learn more about the color-scheme feature you can check out Kevin Powell's video on color-scheme.
Twitter media preview
Apart from small and large image summaries, Twitter has a third preview that you don't see that often: the media preview. It has a small preview image with a play button that expands into a media player. Polypane now supports that card type.

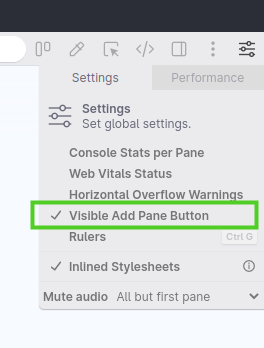
Hide "Add pane" button
In Polypane 8.1 we introduced the "Add pane" button to help people getting started with Polypane figure out how to add panes more quickly. If you don't need the button, you can now hide it in the global options menu in the top right of Polypane.
Double click zoom percentage to fit
When you double click the zoom percentage in the header, it will reset either to 100%, or zoom out to fit all your panes. This brings feature parity with the pane zoom UI, which lets you do the same.

More warnings for intrusive pane settings
In Polypane 8.1 with the introduction of the disable JS debug tool we introduced a new UI that highlighted the disabled JS clearly.

We frequently get support questions that turn out to be caused by a few other debug tools, so we now use the same UI for the following conditions:
- Disable CSS debug tool
- Content Chaos debug tool
- Throttled network emulation
With the new UI it's immediatelly clear that there's something to keep in mind while interacting with a pane.
Notable fixes
This version of Polypane has plenty of fixes, but we wanted to highlight two:
Figma state resetting
The Figma preset in the Browse panel reset to the figma homepage every time you switched from the browse panel to another panel and back. We now preserve whatever Figma file you have open.
Polypane Peek improvements
We fixed a few instances where inspecting elements stopped working or where the inspection tooltip had styling bleed through from the main page.
Inspecting elements now also completely prevents any clicks from propagating to the underlying element, so accidental clicks are prevented even for elements with javascript handlers.
Updated Chromium
Chromium has been updated to 102.0.5005.40, and ships with a number of experimental features turned on by default, like support for container queries and :has(). Head over to our docs on Experimental Chromium Features for a full overview of the available APIs. If you'd like to see one activated, Let us know.
Get Polypane 9
Polypane is available for Windows, Mac (universal dmg for both Intel and M1) and Linux (.deb or AppImage) in both 64 bit and ARM versions.
Polypane automatically updates on Mac, Windows and on Linux when using the AppImage. Otherwise, go to the download page to download the latest version!
Don't have Polypane yet? There is a 14 day trial available. Try it for free.
Deprecation notice
Polypane 9 removed legacy mode.
Polypane 9 Changelog
New Features
- New Screenshot editor.
- New Fast viewport and full page screenshots.
- New Debug tools and focus order overlay support in screenshots.
- New Structured data visualisation in Meta panel.
- New Mobile Friendly tester.
- New Track Focus debug tool.
- New Find small tap targets with Target Size debug tool.
- New Page zoom support.
- New Search in page support.
- New Ability to hide "Add Pane" button.
- New Chromium 102.
- New Support for color-scheme: dark (Thanks Kevin!).
- New Twitter Media preview.
Improvements
- Improved Double click global zoom percentage to zoom to 100% or zoom to fit.
- Improved Hide open devtools whenever a popover or the address bar is active.
- Improved Shortcut overview uses new Shortcut display badges.
- Improved All address bar tooltips now show Shortcut badges (Thanks Florent!).
- Improved Workspaces show shortcut badges in tooltips.
- Improved Meta panel: Suggest
initial-scale=1when its missing. - Improved Debug tool: Disable CSS and content chaos debug tools now shows warning in pane title.
- Improved Debug tool: readability uses an improved calculation.
- Improved Throttled network now shows warning in pane title.
- Improved Performance: Sites with many CSS Custom Properties now respond much faster.
- Improved Performance: chromium devtools are no longer automatically launched for single panes.
- Improved Performance: New tab rendering logic.
- Improved Network throttling is now a toggle button.
- Improved Outline panel: warning for incomplete links like "http://" or "mailto:".
- Improved Outline panel: warning for broken images.
- Improved Outline panel: highlight current page in links overview, and suggest
aria-currentwhen missing. - Improved Outline panel: Show
fetchpriorityattribute. - Improved Outline panel: Focus order overview now shows the
nameof inputs and textareas. - Improved Outline panel: Focus order overview truncates long content.
- Improved Outline panel: Headings and Links "hidden" badge now use the same color.
- Improved Outline panel: Display when an image is inside a link.
- Improved Outline panel: Scroll smoothly to highlighted element.
- Improved Default Mobile and Tablet tabs now use mobile rendering by default.
- Improved Polypane Peek now shows the type for
inputandbutton. - Improved Polypane Peek, elements panel, outline panel: hide the element dimension ratio when it's 1:1.
- Improved Elements panel: Inspected element is now highlighted in treeview.
- Improved Elements panel: Focusing a css value suggestion live previews it.
- Improved Elements panel: Autosuggestions for CSS values, HTML attributes and aria attributes.
- Improved Elements panel: Grey out hidden elements in the tree view.
- Improved Elements panel: Improve design of CSS sections.
- Improved Elements panel: Hidden elements no longer show Peek tooltip when highlighted in tree view.
- Improved Elements panel: Show flex and grid badges in tree view.
- Improved Elements panel: Click event is now fully prevented after inspecting elements.
- Improved Emulation: Color gamut now has an "off" value.
- Improved Emulation: show a title for each emulation option.
- Improved Updated design for context menus.
- Improved Polypane is now included in the WebBrowser category on Linux.
- Improved Support for the
baseelement in link and image resolution. - Improved Updated Google Fonts.
Fixes
- Fix Browse panel: no longer resets URL on tab switch for Figma (Thanks Kevin!).
- Fix Polypane Peek is now more resilient to website styling.
- Fix Debug Tool active dot was not fully visible.
- Fix Active dot for forced colors was not showing.
- Fix Polypane no longer tries to get CrUX data for local pages.
- Fix Elements panel: Text color was cut off in elements panel for elements with many classes.
- Fix Elements panel: now shows CSS styles from inside media queries inside stylesheets linked with
@import. - Fix Elements panel: prevent NaN when updating units without numbers.
- Fix Elements panel: a:link and a:any-link CSS selectors are shown in the elements panel again.
- Fix Elements panel: Inspecting Flickity carousels prevented selection.
- Fix Elements Panel: computed styles no longer show a disable style checkbox.
- Fix issue where context menu "add pane" item didn't create a new pane.
- Fix Creating an overview screenshot no longer triggers "current version is up to date" message in certain situations (Thanks Justin!).
- Fix On Mac, sometimes inspecting twice in a row prevented the node highlight from showing (Thanks Justin!).
- Fix In-app chat position with bottom-aligned panel was in the wrong place.
- Fix Prevent spacebar-dragging from getting stuck after switching away and back to Polypane.
- Fix Custom headers not always applying.
- Fix Meta panel: Facebook preview no longer overflows when there is no facebook data.
- Fix Toggle scroll shortcut was broken.
- Fix Issue where Chromium devtools settings would not persist.
- Fix Icon alignment in debug tools list.
