Table of contents
Skip table of contentsIf you want to be kept up to date with new articles, CSS resources and tools, join our newsletter.
Polypane 29 introduces an updated panel UI, a new network panel for inspecting requests, a new snippet store for discovering and installing snippets, and a custom selectors overview in the outline panel, plus many other improvements and fixes.
Re-introducing the panel
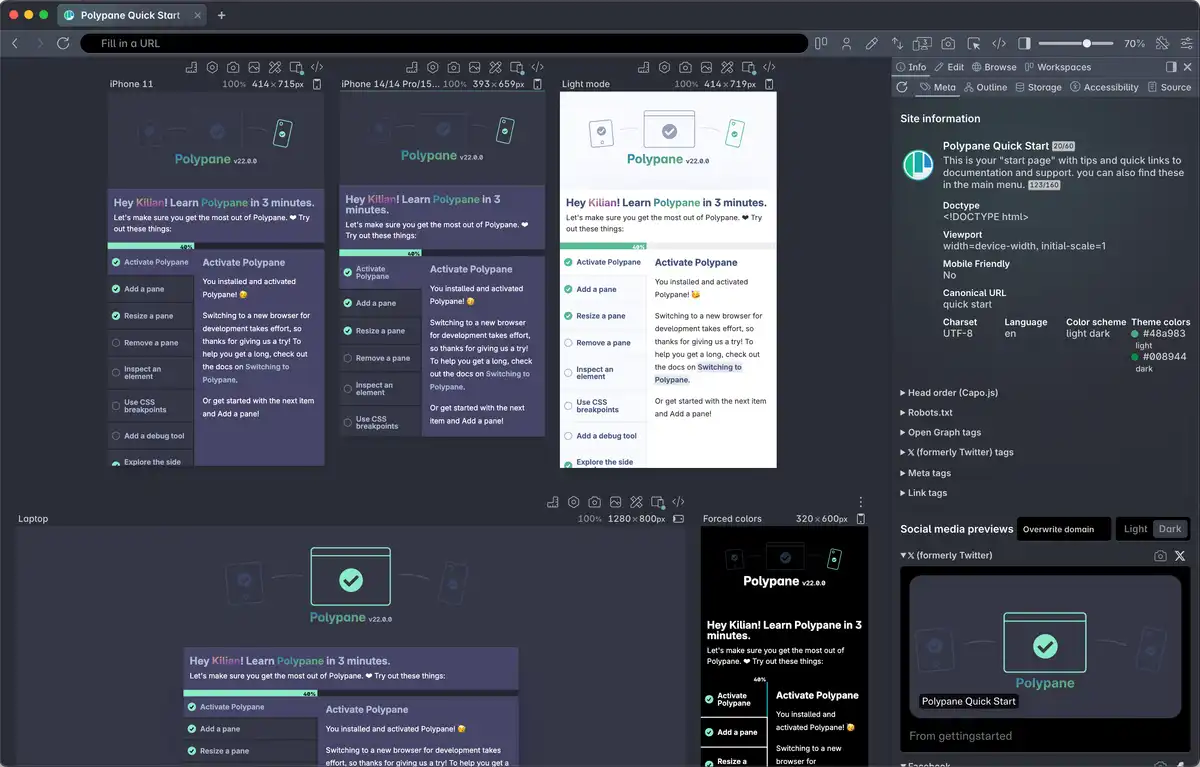
We redesigned the panel navigation to be more familiar to people coming from other browsers. The new single level with overflow menu is a familiar pattern used in devtools in other browsers, while the drag and drop reordering makes it easy to customize the panel to your own needs.
The old multi-level panel navigation was a bit different from what people were used to, and while it had its advantages, it also made it harder for new users to find the features they were looking for.
With the new design, we hope to make it easier for people to get started with Polypane and also for them to find the many features that Polypane has to offer.
It also made it really easy for us to add a new panel:
Network panel
The new network panel is our take on the network panel. Built from the ground up with Polypane's multi-pane architecture in mind and with a focus on showing you actionable data, the new network panel starts off with a high-level overview of your page's load performance and then lets you drill down.
The top of the network panel is meant for glancing: domContentLoaded and load timing, Web Vitals timings and the number of requests and origins. All of these are shown as ranges when they differ per pane.
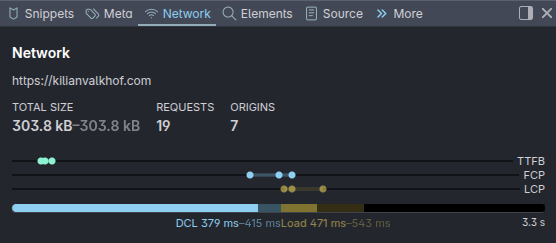
Polypane then shows you the origins your page connects to. Each origin has its own performance characteristics, so it's really useful to see this split out.
It can be quite the eye-opener seeing all the origins your page connects to.
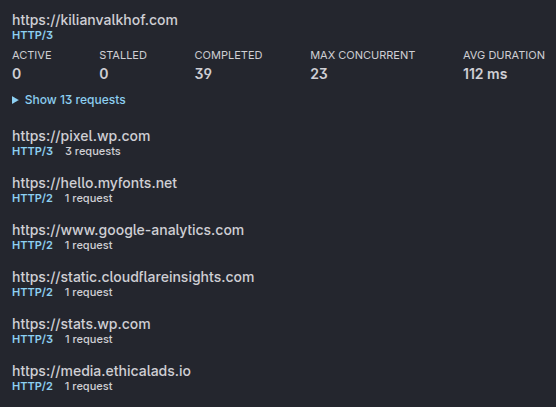
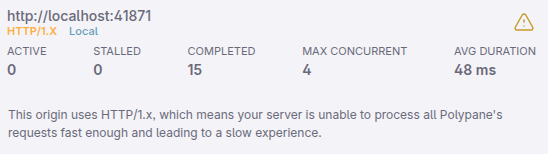
Each origin shows a quick overview of the type of connection and number of requests. If you're accidentally connecting to a slow HTTP/1 server, this tells you instantly.
Your main origin is always expanded, showing you how many requests are active, stalled or completed, how many concurrent connections the origin supports and the average download time.
The request table is fully featured and interactive, so you can really dig into the performance characteristics of your page and find bottlenecks and issues.
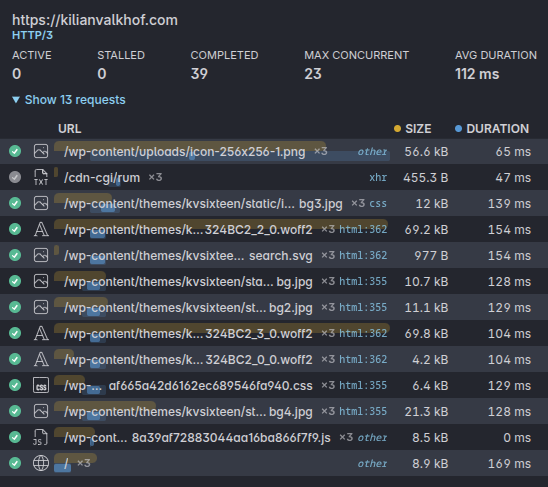
By default the table shows the load waterfall so you know which resources depend on which other resources and how long they took to load, and you can sort the table by any column to find the slowest resources, or the ones that are blocking the most other resources.
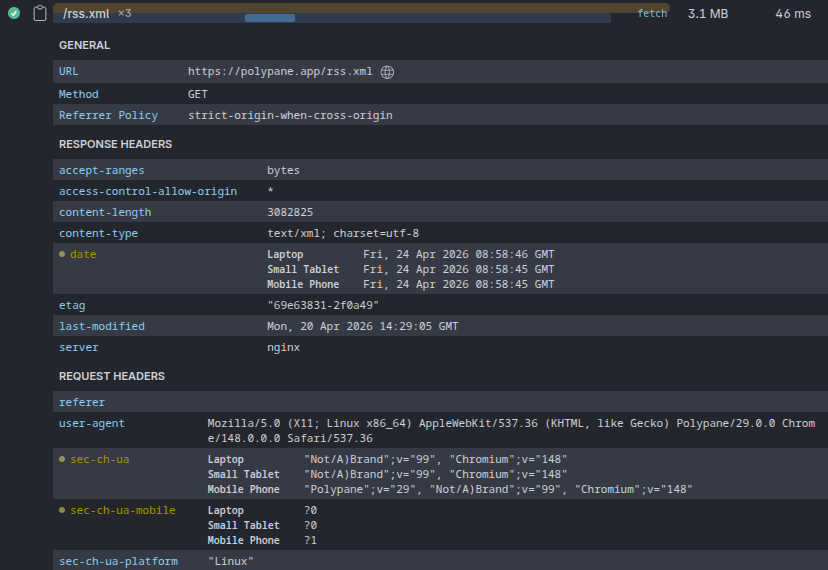
For each request you can show the headers split out in general info, response and request headers. If headers are different per pane, they're annotated and the differences are highlighted so you can easily spot them.
The network panel lets you see things at a glance or really dive deep into the performance characteristics of your page, and we have a lot of plans to expand on this in the future.
If you have suggestions for what you'd like to see in the network panel, let us know!
Server bottleneck monitoring
Most dev servers use HTTP/1, which only supports up to 6 concurrent connections. That can lead to requests in Polypane being stalled while it's waiting for a connection to become available.
Some people mistakenly think that this is a Polypane issue. In reality, we're just waiting for the server to send data. Starting in 29, we show a warning in the address bar and the network panel when we notice this server bottleneck.
We're also expanding our connection whitelist, that allows us to open more connections to servers running on localhost, to Docker IPs running on the local subnet. This means faster local servers even if they are running in a container.
Snippet store
The new Snippets store is the place to find and install snippets and snippet collections created by the Polypane team and our community. You can find snippets for all kinds of use cases like accessibility, performance, quick debugging and even some that are just for fun.
Installing snippets
Open the snippet store in Polypane to browse the available snippets and install the ones you find useful right from the website. Click an install button and Polypane will automatically install the snippet for you, no need to download files or import them manually.
After installing, the snippet is available from the snippets panel and the command bar and you can apply it to all panes or specific panes as needed.
In other browsers, snippets can be downloaded as a file so you can import them into Polypane.
Contributing snippets
You can contribute your own snippets to the store by submitting a PR to the Polypane snippets repository on GitHub. You can find all the instructions on how to do that in the README in that repository.
We are looking forward to seeing what snippets the community will come up with!
Snippet live preview
Snippets replaced our old Live CSS Preview panel with a much more powerful and flexible system, but in the process we lost the ability to see your CSS be directly applied to the page as you type it. The new live preview option brings it back!
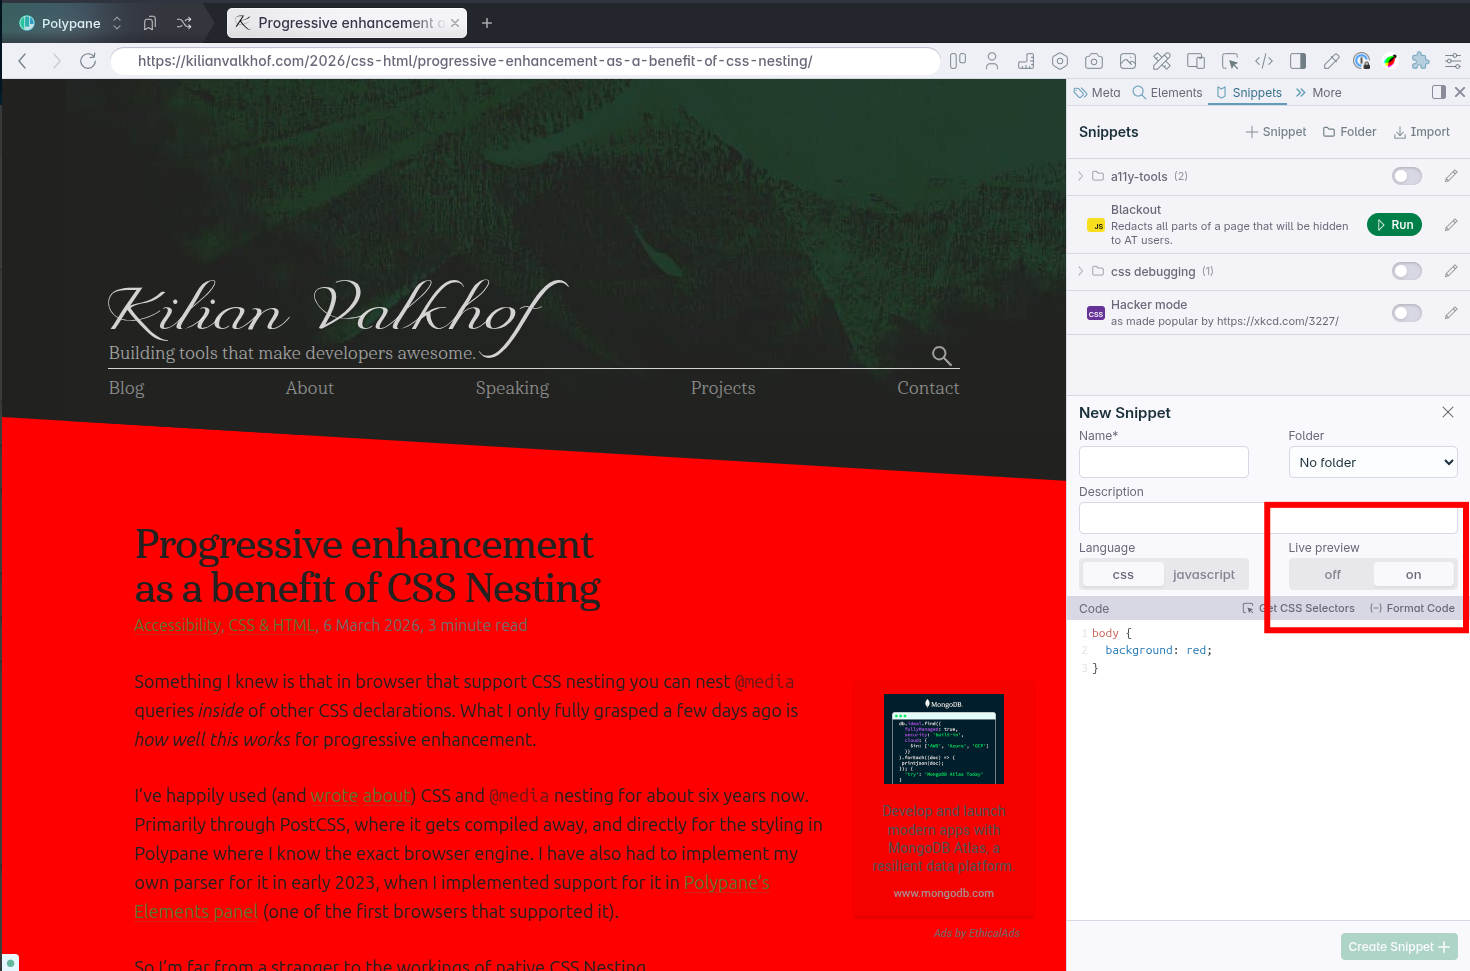
When editing or adding a CSS snippet you can now toggle the "live preview" on to see the changes you make to your CSS snippet directly applied to the page.
Even with the live preview, we will still automatically load any Google fonts you use in your snippets, so you can use those without having to worry about it.
Polypane Peek improvements
We made two quite significant improvements to Polypane peek: iframes are now inspectable, and grid and flex visualisations.
Peek lets you hold ⌥ while hovering over an element to quickly see the styles, dimensions, accessibility information and more. It's a great way to inspect elements without having to open the Elements panel and find the element in the tree view.
Grid and flex visualisations
We now automatically show visualisations for grid and flex containers when inspecting them with Peek. While you could already turn these on from the tree view in the Elements panel, having them be available in Peek makes it much easier to quickly check if things are laid out the way you expect.
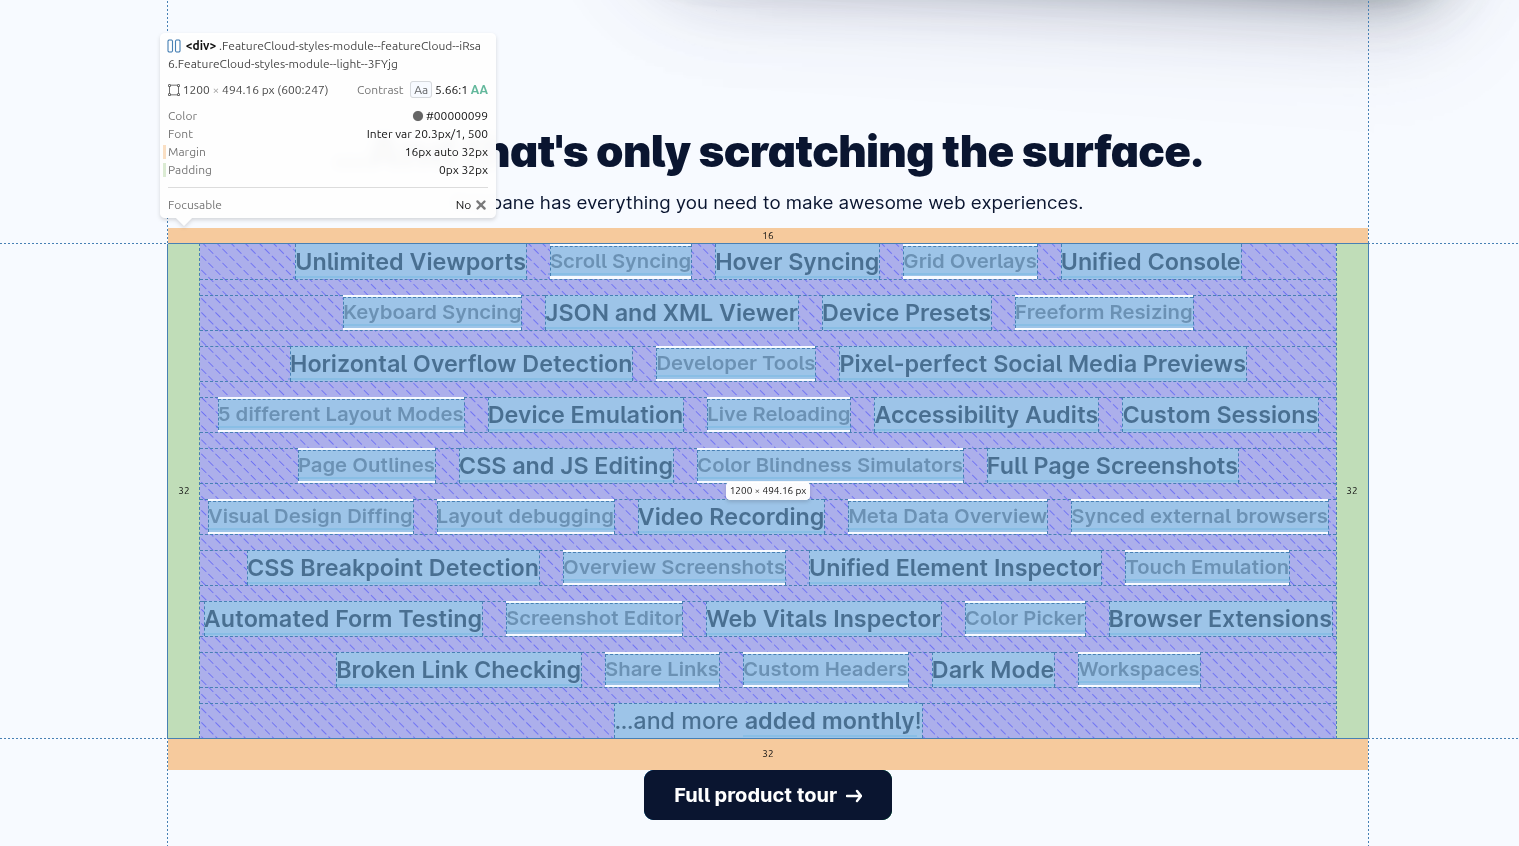
Now, it wouldn't be a Polypane feature if we didn't do a little bit extra in our visualisations compared to what you can find in other browsers.
Polypane highlights the child nodes instead of the areas. This means that you don't just see the container configuration, but you can also see the alignment of child nodes within those areas.
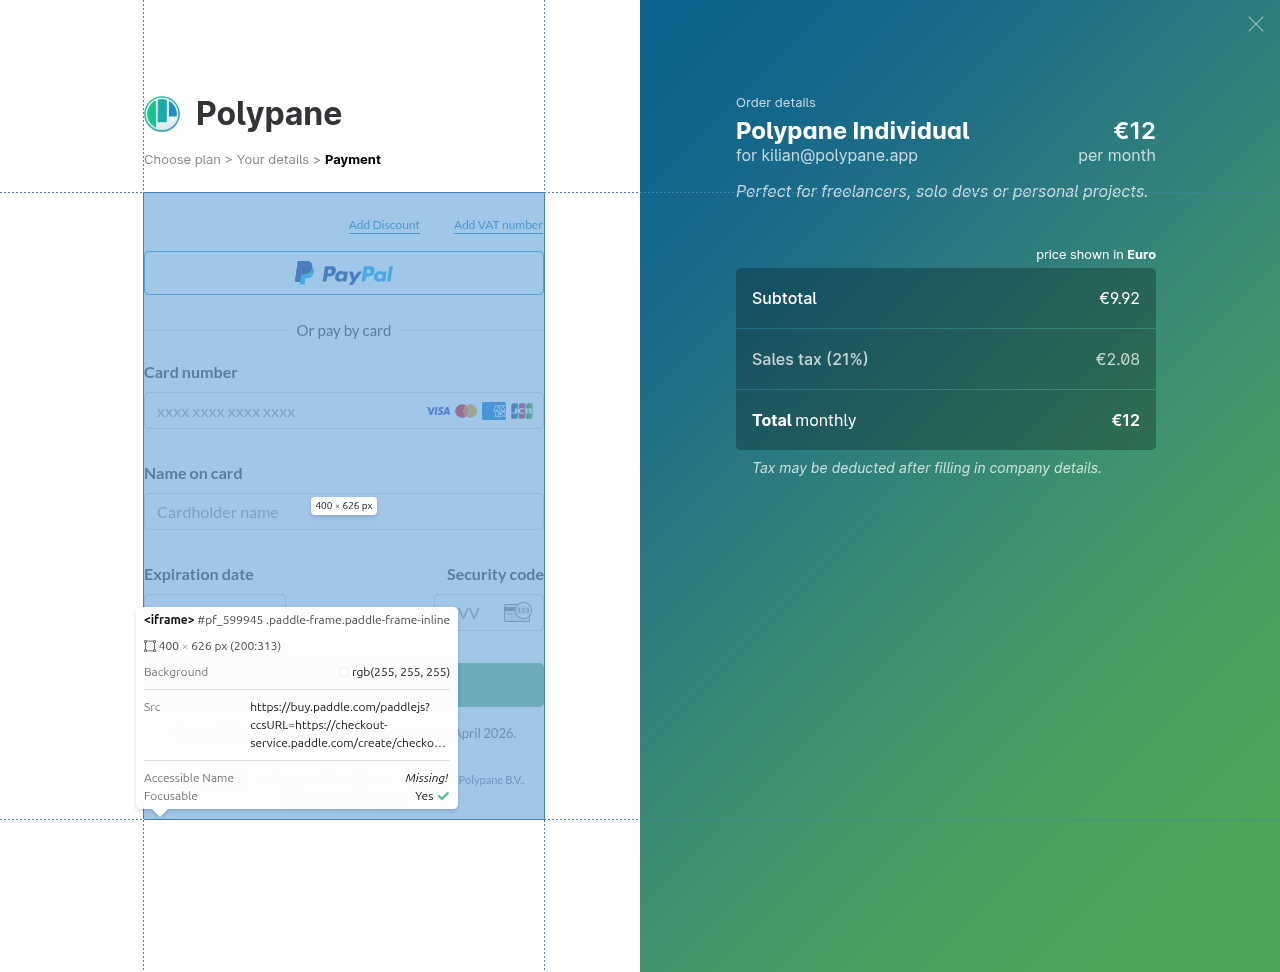
Inspectable iframes
When you hover over an iframe, we now correctly show the information and element highlight, something that was previously not possible.
Outline panel
We added a new overview, and improved the accessibility tree in the outline panel.
Custom selectors overview
Between headers, landmarks, images and links, the outline panel already gives you a great overview of the structure of your page. But sometimes you need an overview of something more specific.
With the new custom selectors overview, you can now use any CSS selector to get an overview of all the elements that match that selector on your page. For example, use table to find all tables, [aria-live] to get an overview of all the live regions on your page, or use button, [role="button"] to get an overview of all the buttons split out between real ones and those that have a button role. This is especially useful for accessibility debugging, but can also be used for finding specific elements on the page.
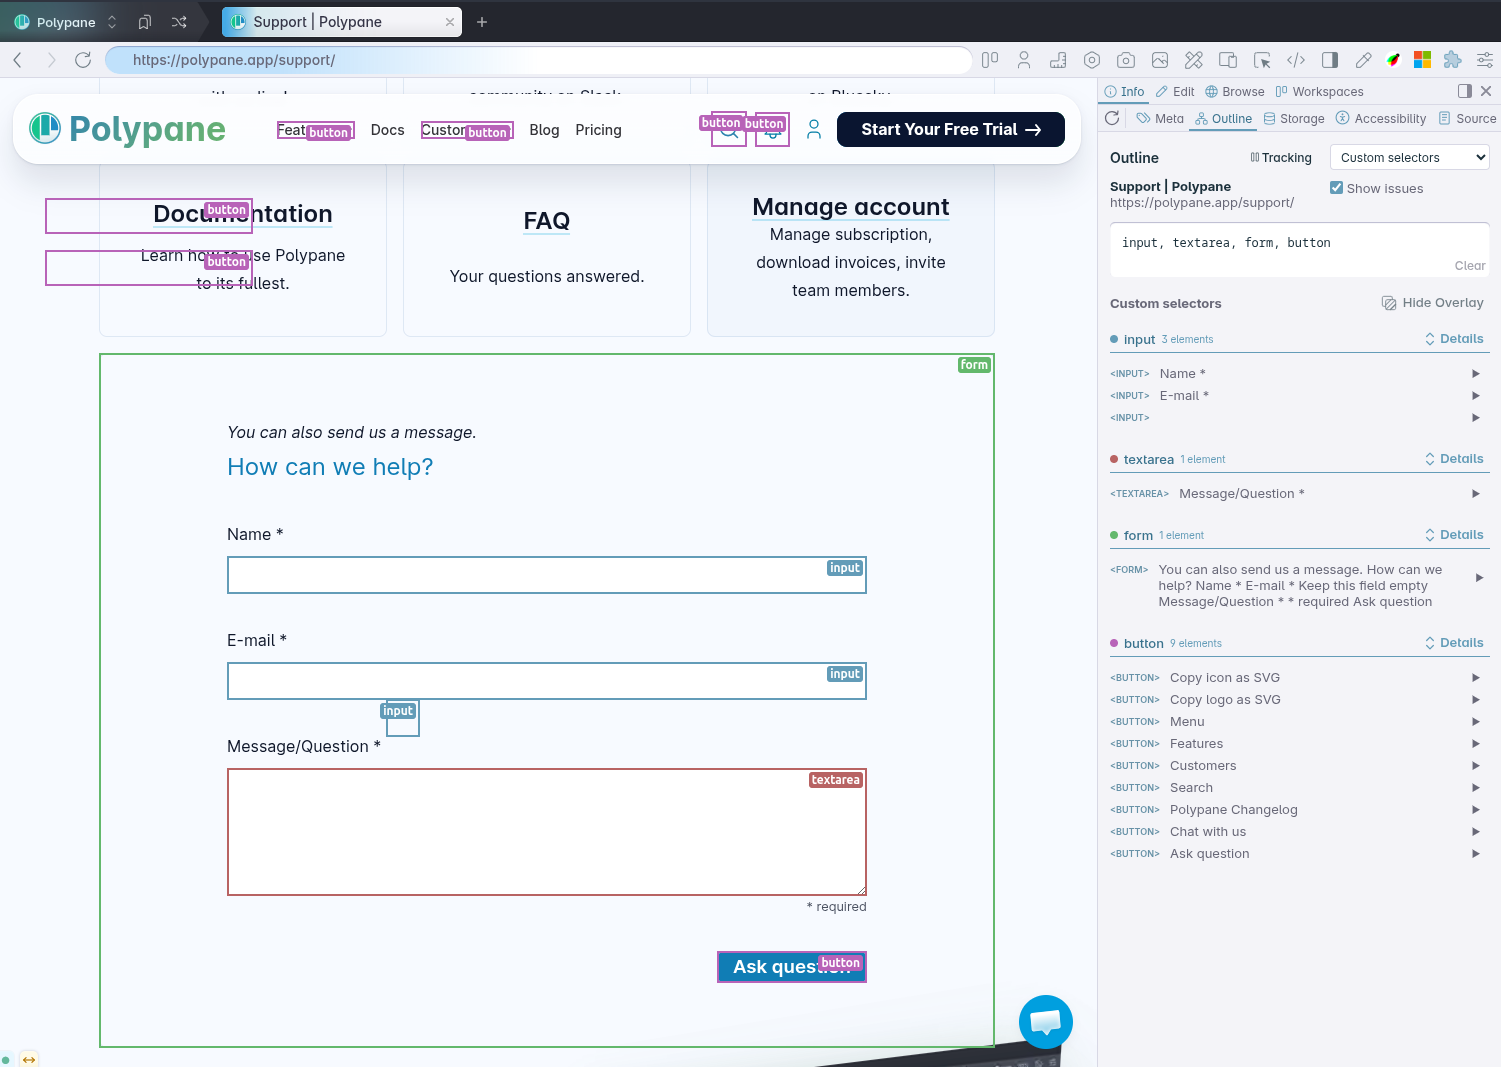
When you add multiple selectors, separated by a comma, the outline panel automatically groups them and gives each selector a unique color so you can easily see which elements match what selector in the overlay.
Accessibility tree improvements
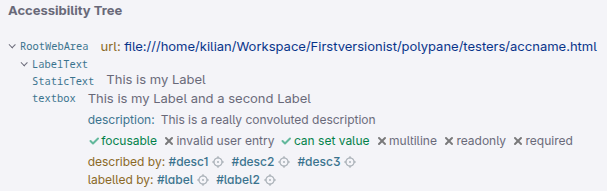
The accessibility tree now lists the description for an element and makes it easy to inspect the referenced element IDs.
Additionally, the tree should now both update more quickly and also be more stable when you're working with a page that has a lot of accessibility tree changes so you don't lose your place in the tree when you're inspecting accessibility issues.
Elements panel improvements
The elements panel got a few nice bug fixes and improvements in this release, making for a more stable environment even when dealing with a DOM with lots of events, changes and hot reloading logic.
Much easier pseudo state toggling
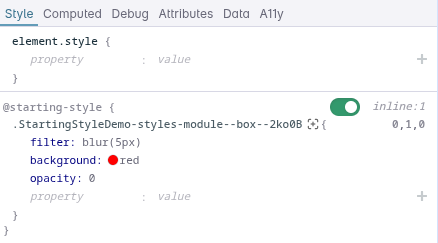
Toggling pseudo states like :hover and :active is now much easier to do. Instead of opening the pseudo state menu in the navigator, the style tab now has toggle buttons for all the pseudo styles you have defined for an element. Co-locating these with the styles for that pseudo state makes it so much easier to use, and a big thanks to Eric for coming up with this feature.
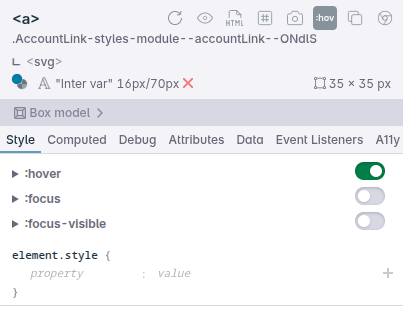
Oh, by the way, it also works for @starting-style rules!
More info in the Element A11y tab
For the A11y tab we made two improvements that make it easier to see what's going on. Firstly, it now shows the aria-describedby value if set, so you know what additional information is being provided to assistive technologies.
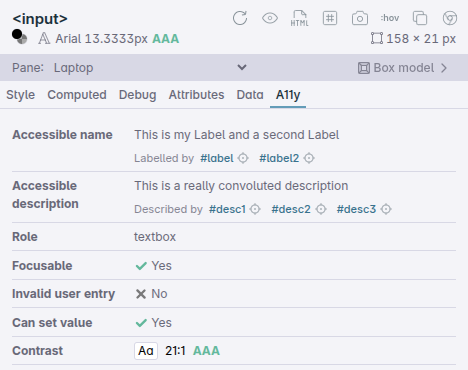
Secondly, we now link all labelledby and describedby elements right below their value and make it easy to see how your accessible name and description are being constructed.
Tree view keyboard interactions
The tree view already has arrow keys navigation and lets you hide elements using h. Now you can also use the del key to remove elements from the tree view.
Deleting elements was already available in the context menu, but if you're already on the keyboard, it's much faster to just hit del.
Quicker data refreshing
We've updated the logic that determines when we need to update element styles. This makes it work much better for modern dev servers with very precise style updates and injection.
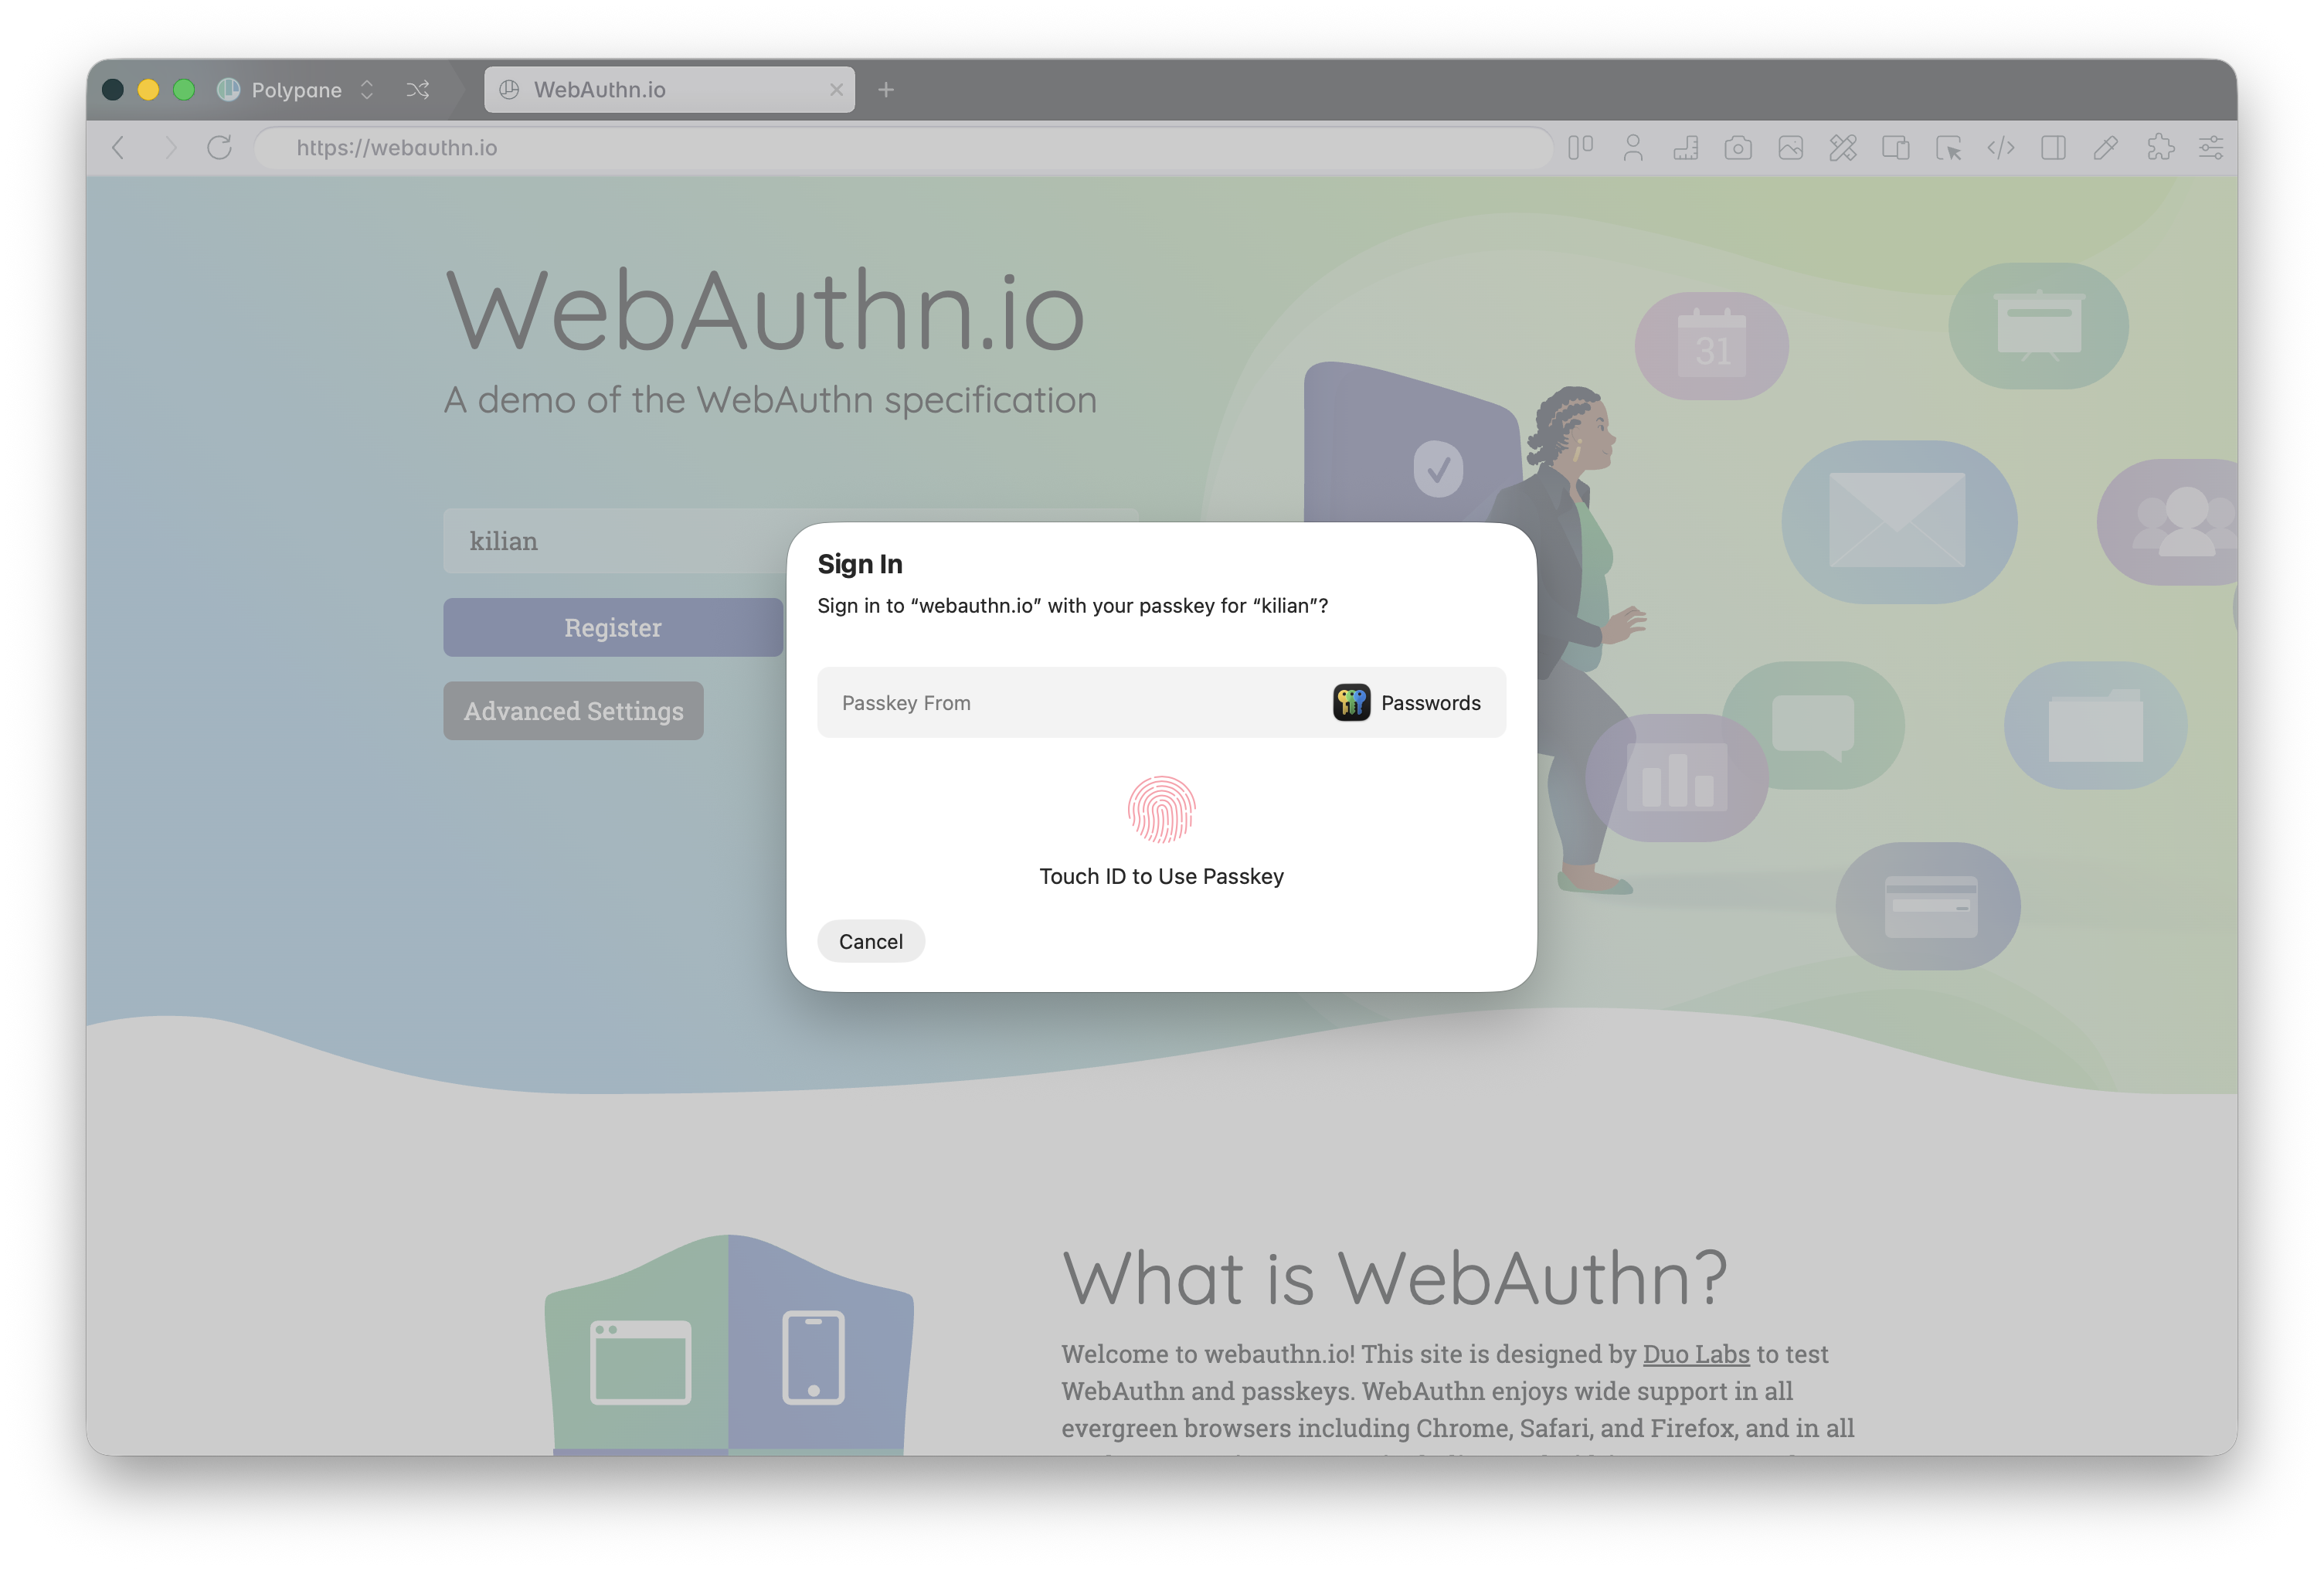
Passkeys keychain integration on macOS
It took us a while to go through Apple's process to integrate with the passkey system, but Polypane now has first-class support for passkeys on macOS. As a result, the Apple password manager browser extension should now also work much better in Polypane.
Passkey support on Windows was already supported through Windows Security, and on Linux, which has no centralised security system, passkeys are supported by installing an extension that supports them, like 1Password.
WhatsApp preview in Meta panel
As our 11th(!) social media visualisation we added support for WhatsApp's link previews:
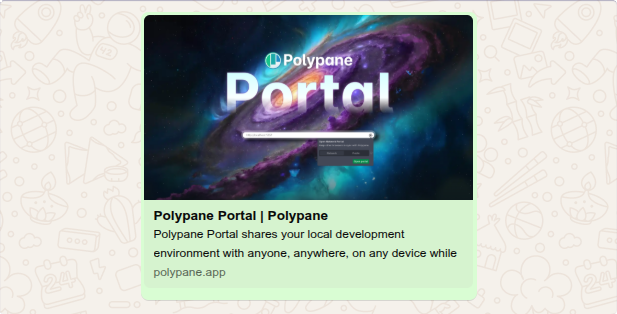
It's pixel perfect in both Light and Dark mode (but you expected that, right?)
Devtools panel: Inspect shared workers and service workers
If you've ever needed to inspect shared workers or service workers, you know that it's a bit of a hassle to have to go to chrome://inspect and find workers there. In Polypane we now just show shared workers and service workers in the devtools panel dropdown when you have a page open that has them.
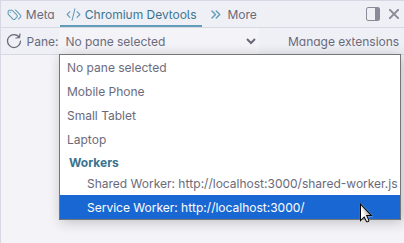
Just select the worker you want to inspect from the dropdown and you'll get a full devtools window to inspect the worker, just like you would in Chrome.
Smaller improvements and fixes
Quickly inspect elements in the Elements panel from the Find elements bar
When using the find element feature to find elements on the page, you can now jump to the Elements panel with that element selected by hitting ⌘ enter. This makes it much easier to inspect the element you found in the Elements panel without having to find it again in the tree view.

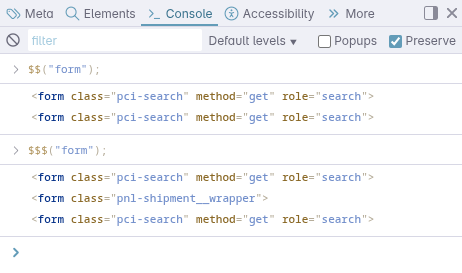
Find elements inside shadow DOM
We have a new helper function $$$() in the Console that works just like $$() but also searches inside shadow DOM. If you make use of web components, this will help you find elements that are otherwise hidden from the console's $$() function!
Form autofilling
Form autofilling is now a little bit smarter. If you right-click an input field, we now automatically move matching lists to the top of the custom values context menu. Right click a field with a type of email, and the first item in the list of custom values is email addresses. If the autocomplete asks for a postcode, then the first item in the list of custom values is Postcodes. This way, you can fill in common fields with the right values without having to scroll through your entire list of custom values.
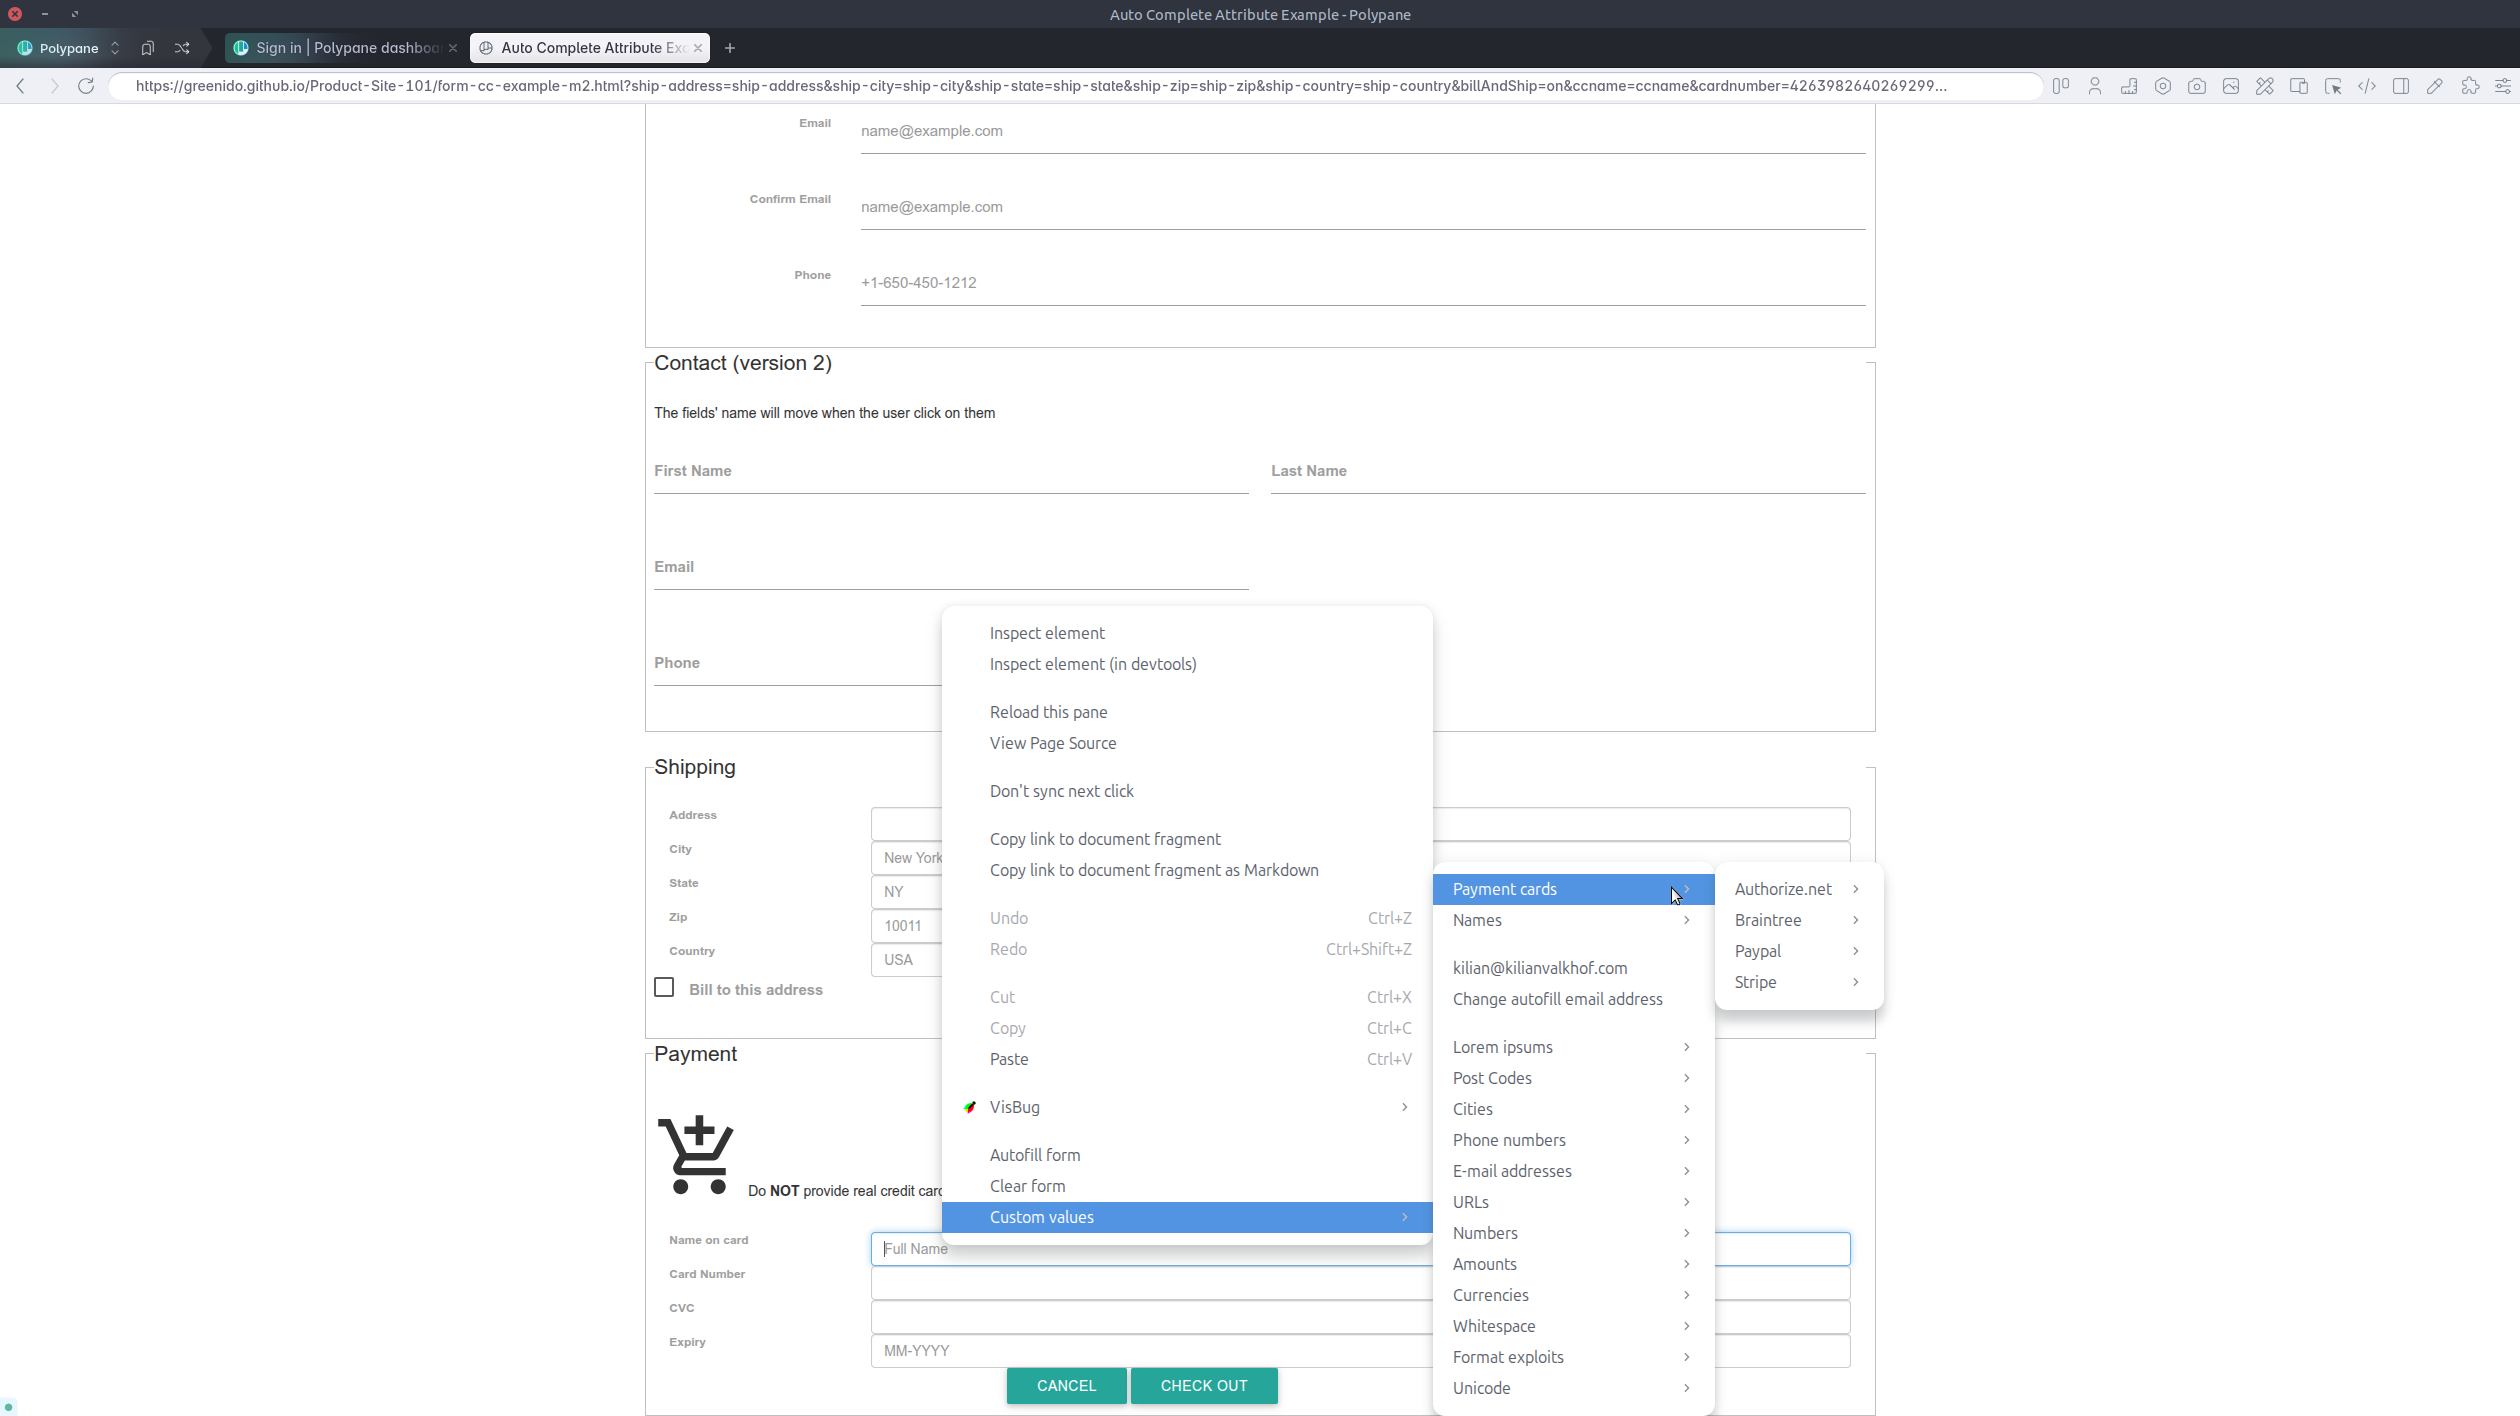
Speaking of email addresses, there's now also the option to fill the input with a custom email address. By default we use your account email address, but you can change that right from the context menu to whatever is most useful to you. This makes testing real forms even easier, since you can quickly fill in the form with a valid email address that you have access to.
JSON viewer
When opening a JSON file, the built-in JSON viewer now also makes the JSON available in the console as window.json. This means that you can easily access the data from the console to do further debugging or testing with it, or when you want to drill down and get a programmatic overview of the path rather than just inspect it.
Chromium 148
Polypane 29 is built on Chromium 148.0.7778.56. Notably available in this release is the new html-in-canvas API that we have enabled by default. For all the experimental features enabled in this release, check out the experimental web platform features overview.
Get Polypane 29
Polypane is available for Windows, Mac and Linux in 64 bit and ARM versions.
Polypane automatically updates on Mac, Windows and on Linux when using the AppImage. Otherwise, go to the download page to download the latest version!
Don't have Polypane yet? There is a 14-day trial available.
Try it for free. No credit card needed.
Polypane 29 Changelog
New
- New Network panel
- New Snippet store
- New Panel: Switch to single-line with overflow tab bar
- New Grid/Flex visualisations in Polypane Peek
- New Outline panel: Custom selector overview
- New Passkeys keychain integration on macOS
- New Meta panel: WhatsApp preview
- New Devtools panel: Inspect shared workers and service workers (Thanks Przemyslaw!)
- New Snippets panel: live preview option (Thanks Kari!)
- New Activated html-in-canvas API by default
- New Chromium 148.0.7778.56
Improvements
- Improved Polypane Peek: iframes are now inspectable and can be selected
- Improved Load performance for custom local domains (Thanks Mike!)
- Improved Confirmation dialogs are now deduplicated when called multiple times in a row (Thanks Matija!)
- Improved JSON viewer: Makes data available in the console as window.json
- Improved Elements panel: A11y tab now links all labelledby elements (Thanks Eric!)
- Improved Elements panel: A11y tab now shows aria-describedby value (Thanks Eric!)
- Improved Elements panel: Stable references to elements for hot reloading dev servers (Thanks Matyáš!)
- Improved Elements panel: Load new styles on injection by hot reload servers (Thanks Matyáš!)
- Improved Elements panel: Toggle pseudo styles in style panel (Thanks Eric!)
- Improved Elements panel: del key now removes element in tree view
- Improved Console panel: new $$$() helper that also searches shadow DOM.
- Improved Outline panel: Accessibility tree now shows a description as well as the referenced IDs (Thanks Eric!)
- Improved Basic auth popup now follows the system design
- Improved Form autofill: Ability to use a default email address (Thanks Tom!)
- Improved Form autofill: Move lists matching the element to the top
- Improved Find elements: cmd/ctrl + enter now shows element in Elements panel (Thanks Ricky!)
- Improved Debug tools: Improve wording in Color contrast tool (Thanks Ana!)
- Improved Snippets Editor: Improved layout when editing
- Improved Traffic lights alignment on macOS 26 is now improved
- Improved Session management: Add confirmation dialog before deleting session
- Improved Pane resizing performance when you have a lot of panes open
- Improved More deterministic page loading after click actions
- Improved Integrations: new Marker.io logo
Fixes
- Fix Elements panel: Improve accessible name calculation labeled by elements with roles without accname (Thanks Eric!)
- Fix Elements panel: Events badge was not visible in tree view (Thanks Ashlee!)
- Fix Elements panel: Allow editing the color of an image-only background property
- Fix Elements panel: Copy CSS for keyframes was missing the animation name
- Fix Elements panel: Font weight wasn't accurate for contrast calculation in A11y tab
- Fix Browse panel: Previous tab shortcut was not working (Thanks Matija!)
- Fix Browse panel: New window from panel did not always create new tab
- Fix Browse panel: New tab should focus access bar (Thanks Matija!)
- Fix Browse panel: Add extension button did not work
- Fix Full page screenshots: use correct viewport height when making screenshots
- Fix Context menu: 'Save link as...' option did not work
- Fix Outline panel: Prevent accessibility tree from collapsing focused elements
- Fix Outline panel: Prevent double tooltips when hovering over elements
- Fix Styles: Prevent React router from trashing styles on load (Thanks Nathan!)
- Fix Console panel: Prevent extra white space in styled console messages
- Fix 'No internet connection' warning is now aligned correctly
- Fix Meta panel: The suggested file name now includes correct name