Documentation
Learn how Polypane improves your workflow
Intro to panel
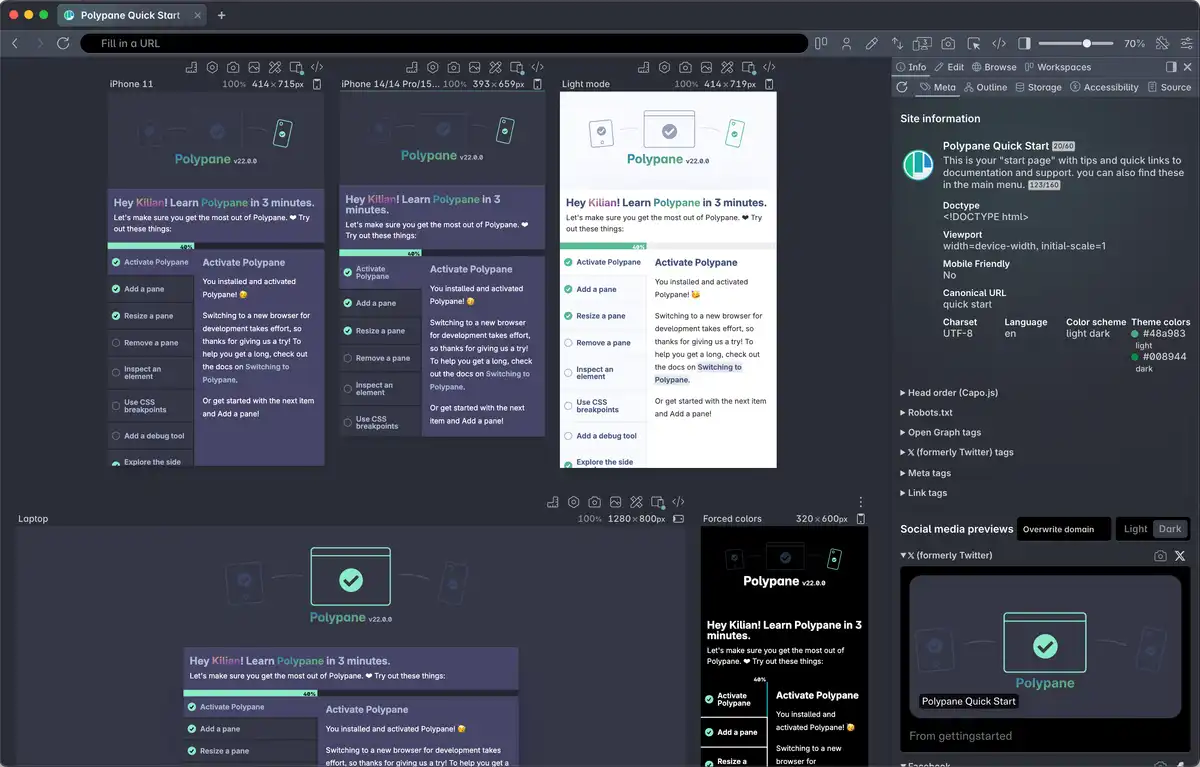
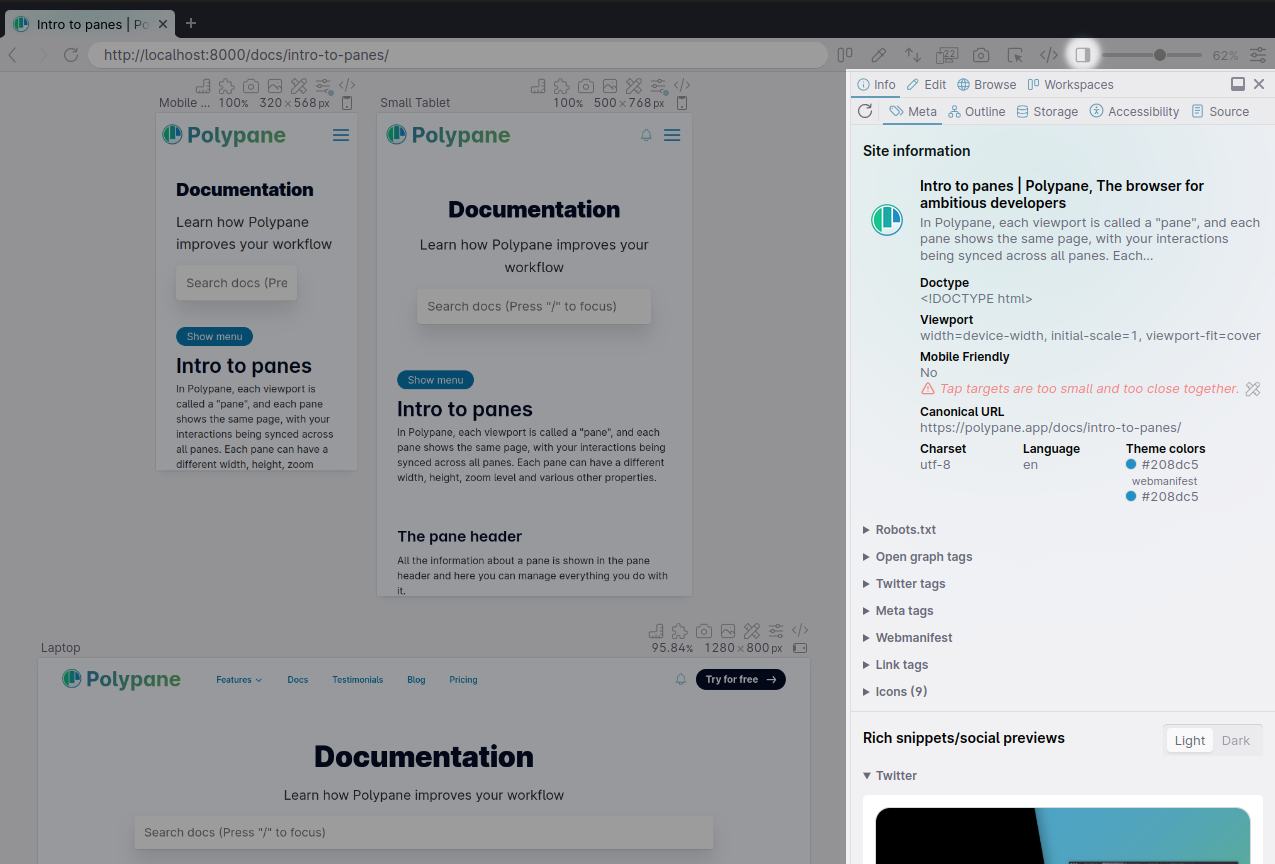
The Polypane panel is where you can find a ton of information on your page as well as ways to inspect and edit the page.
You can open it with ⇧ ⌘ p, by selecting "Toggle Panel" in the "View" menu or by clicking the Open Panel icon in the address bar.
Customizing the Panel location
Drag the side of the panel to resize, or click the panel icon in the top right of the panel to switch between having the panel on the right side, the bottom, the left side or detached in its on window. You can also right-click the side panel icon in the address bar to pick where the Panel should open.
Customizing the panel tabs
The tabs in the panel are shown in a single row at the top of the panel. When there are more tabs than can fit in the row, the remaining tabs are available in the "more" dropdown at the end of the row.
Rearrange the tabs by dragging them to put the ones you use most at the start of the row.
Available tabs in the panel
The panel has 12 tabs that each offer specific ways to inspect, analize and edit your pages, or provide additional tooling:
- Meta
- Elements
- Console
- Outline
- Browse
- Workspaces
- Chromium Devtools
- Snippets
- Accessibility
- Network
- Storage
- Source
These are shown at the top of the panel with overflowing tabs available in the "more" dropdown at the end, similar to how devtools in other browsers work.
Tabs can be rearranged by dragging them so you can put the ones you use most at the start.
Meta information
The Meta information panel gives you insights into the non-visual aspects of your website like meta tags, resource files like robots.txt, and generates social media previews.
Elements
The elements panel lets you inspect and edit elements in all panes at once.
Console
The Polypane console lets you interact with all panes at once, sending commands and viewing console messages in all panes simultaneously.
Outline
The Outline tab shows you various outlines of your page like a list of headings, links, images or landmarks, along with checks for valid structures, broken links and more.
Browse tab
The browse panel lets you show any other website opened alongside your workspace, letting you have your documentation or design system open without having to tab back and forth. It also gives you quick access to various handoff tools.
Workspaces tab
Manage and switch between your saved workspaces, use the default workspaces or export your workspace to share with your team or include it in your repository.
Chromium Devtools
The devtools panel lets you use the Chromium devtools for individual panes and use devtools extensions.
Snippets
With the snippets functionality in Polypane you can quickly apply JavaScript or CSS snippets to all or specific panes to test out code, run checks or make quick fixes without needing to go to the devtools.
Accessibility
Runs a full accessibility audit on the current page to quickly find any glaring issues.
Network
The network panel lets you inspect which resources are loaded by the page. It shows network requests and responses, web vitals and loading information and helps you diagnose performance issues.
Storage
The storage panel shows you the data saved in localStorage, sessionStorage and cookies. You can also edit their values in this panel.
Source
Show the generated HTML source along with HTML validation.
Have a question about Polypane?
Reach out via (real human) chat, Slack or our contact form:
Contact SupportBuild your next project with Polypane
- Use all features on all plans
- On Mac, Windows and Linux
- 14-day free trial – no credit card needed