Documentation
Learn how Polypane improves your workflow
Developer tools
Polypane comes with two sets of developers tools: the native Polypane developer tools and the Chromium developer tools.
Polypane developer tools
The Polypane developer tools will work across panes and you can find more information about them on the following pages:
- Polypane elements panel, lets you edit style, content and attributes in all panes at the same time.
- Polypane Console lets you view console messages from all panes and send console commands to all panes at the same time.
Chromium developer tools
The Chromium developer tools only support a single pane at a time, but also allow you to use browser extensions.
Picking devtools
You can default to using the Chromium developer tools by right-clicking the inspect icon in the address bar.
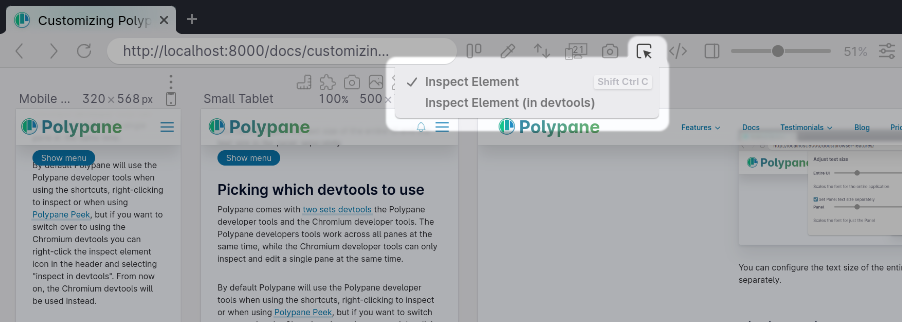
By default Polypane will use the Polypane developer tools when using the shortcuts, right-clicking to inspect or when using Polypane Peek, but if you want to switch over to using the Chromium devtools you can right-click the inspect element icon in the header and select "inspect in devtools". From now on, the Chromium devtools will be used instead.
When "Inspect Element (in devtools)" is set as the default, shortcuts and Polypane Peek will use the Chromium devtools and the first option in the context menu will also use the Chromium devtools.
Have a question about Polypane?
Reach out via (real human) chat, Slack or our contact form:
Contact SupportBuild your next project with Polypane
- Use all features on all plans
- On Mac, Windows and Linux
- 14-day free trial – no credit card needed