Documentation
Learn how Polypane improves your workflow
Web Vitals
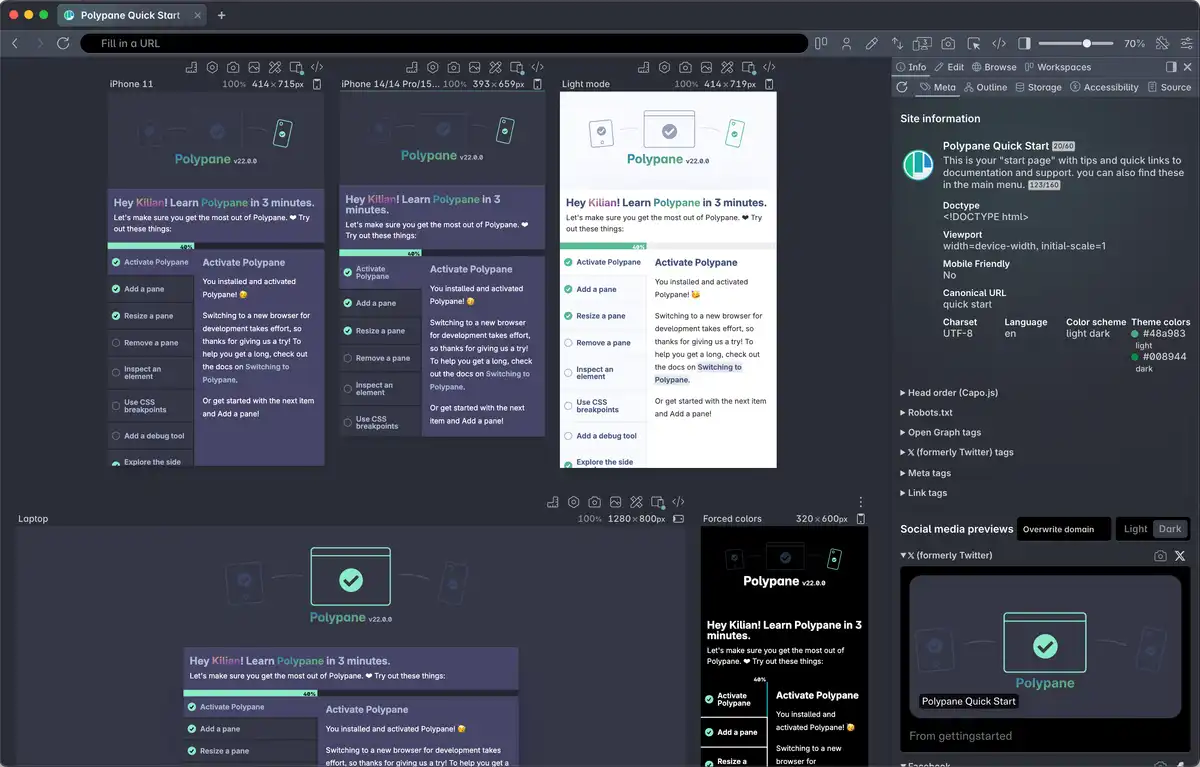
Polypane automatically measures Core Web Vitals for every pane as you browse, giving you real-time performance feedback without leaving your development environment. Unlike other tools that require a separate audit step, Web Vitals are always visible at the bottom of each pane (once turned on)
Polypane automatically compares your scores against real-world field data from the Chrome User Experience Report (CrUX), so you can see how your local build compares to what real users actually experience.
To enable Web Vitals, check "Show webvitals status" in the Global settings (top right of the app).
When all your web vitals are in the "good" range, a green circle is shown. When any need improvement, an orange square is shown alongside the web vital and its score. For "poor" scores, a red triangle is shown.
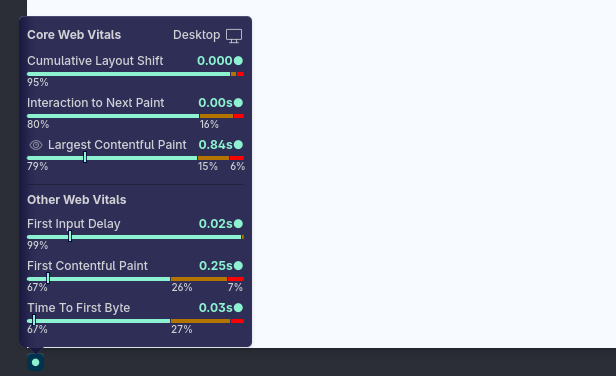
Hover over the icon to get an overview of all Web Vitals and their scores.
Supported web vitals
Core web vitals:
- CLS: Cumulative Layout Shift
- INP: Interaction to Next Paint
- LCP: Largest Contentful Paint
Other web vitals:
- FCP: First Contentful Paint
- TTFB: Time To First Byte
Keep in mind that web vitals scoring is non-deterministic to will differ somewhat on each reload.
Compare your experience to the global averages with CrUX Field Data
When you open the Web Vitals popup we will compare the current pane's score to the Field data gathered by CrUX (when available). This way you can see at what percentile your experience sits at, and how your page is doing globally. Use this to compare how closely your experience matches the average of your visitors.
CrUX data is available separately for Mobile and Desktop, Polypane will automatically select the one most applicable to the current pane.
CLS visualisation
Click the eye icon next to the Cumulative Layout Shift score to visualize which elements shifts caused your CLS score. With this visualisation, you can pinpoint the Elements whose CSS you need to fix to improve your CLS.
LCP visualisation
Click the eye icon next to the Largest Contentful Paint to highlight the element causing the largest contentful paint.
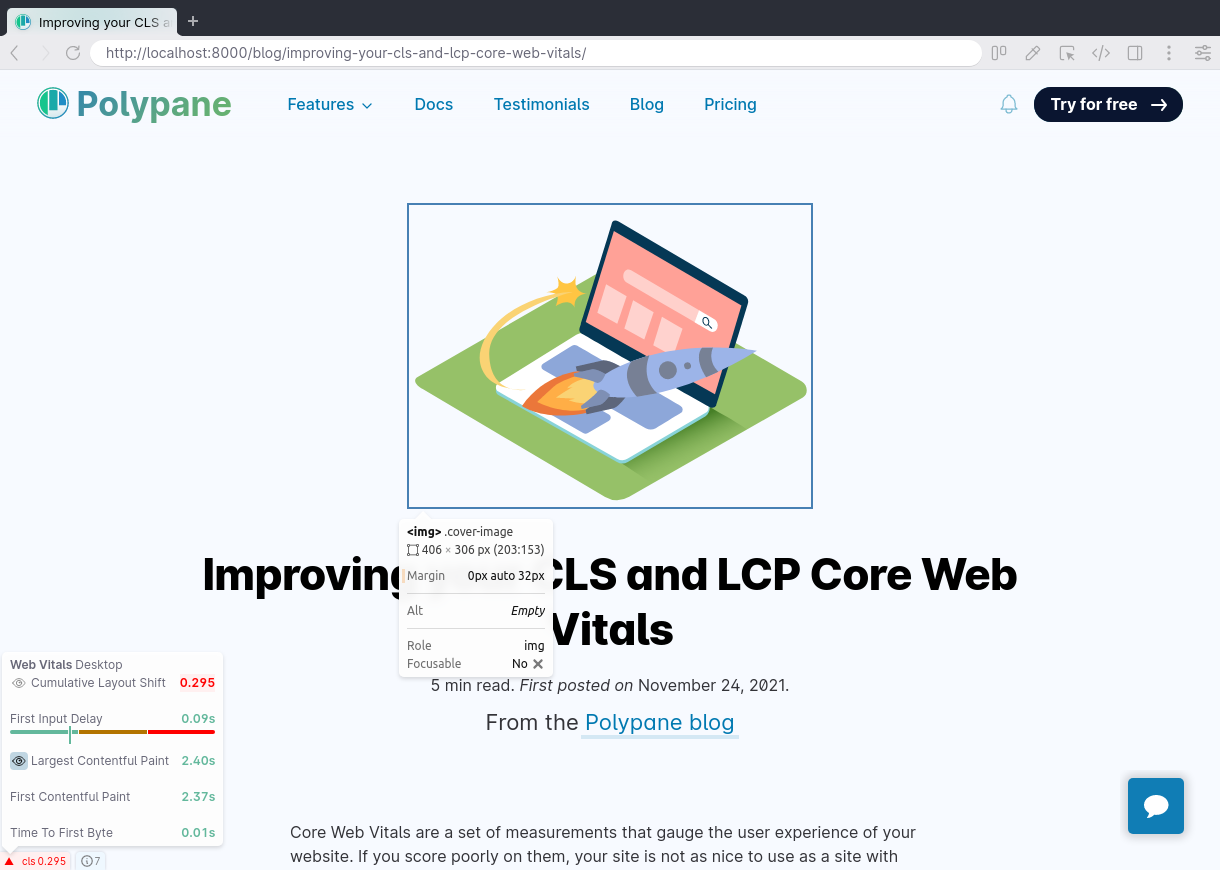
Learn more about how to analyze and improve your CLS and LCP on our blog: Improving your CLS and LCP Core Web Vitals.
INP attribution
Click the eye icon next to the Interation to Next Paint to highlight the element and event type that affected your INP score.
Have a question about Polypane?
Reach out via (real human) chat, Slack or our contact form:
Contact SupportBuild your next project with Polypane
- Use all features on all plans
- On Mac, Windows and Linux
- 14-day free trial – no credit card needed