Documentation
Learn how Polypane improves your workflow
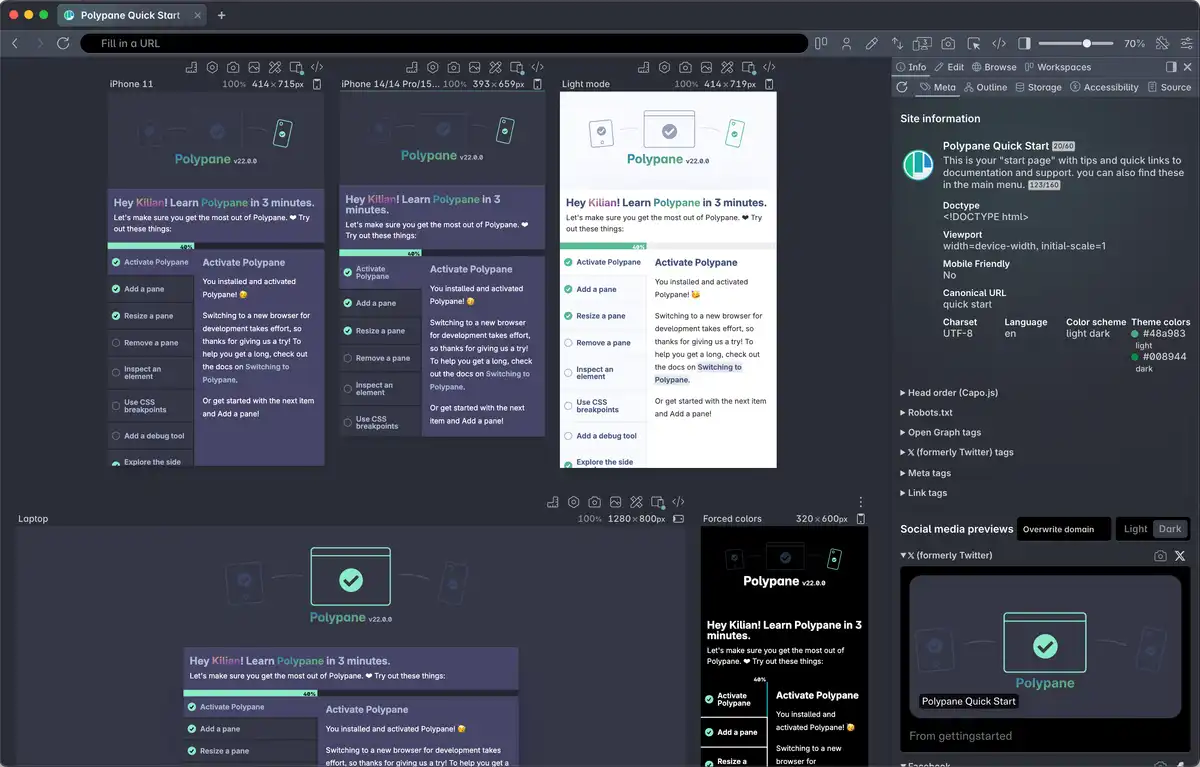
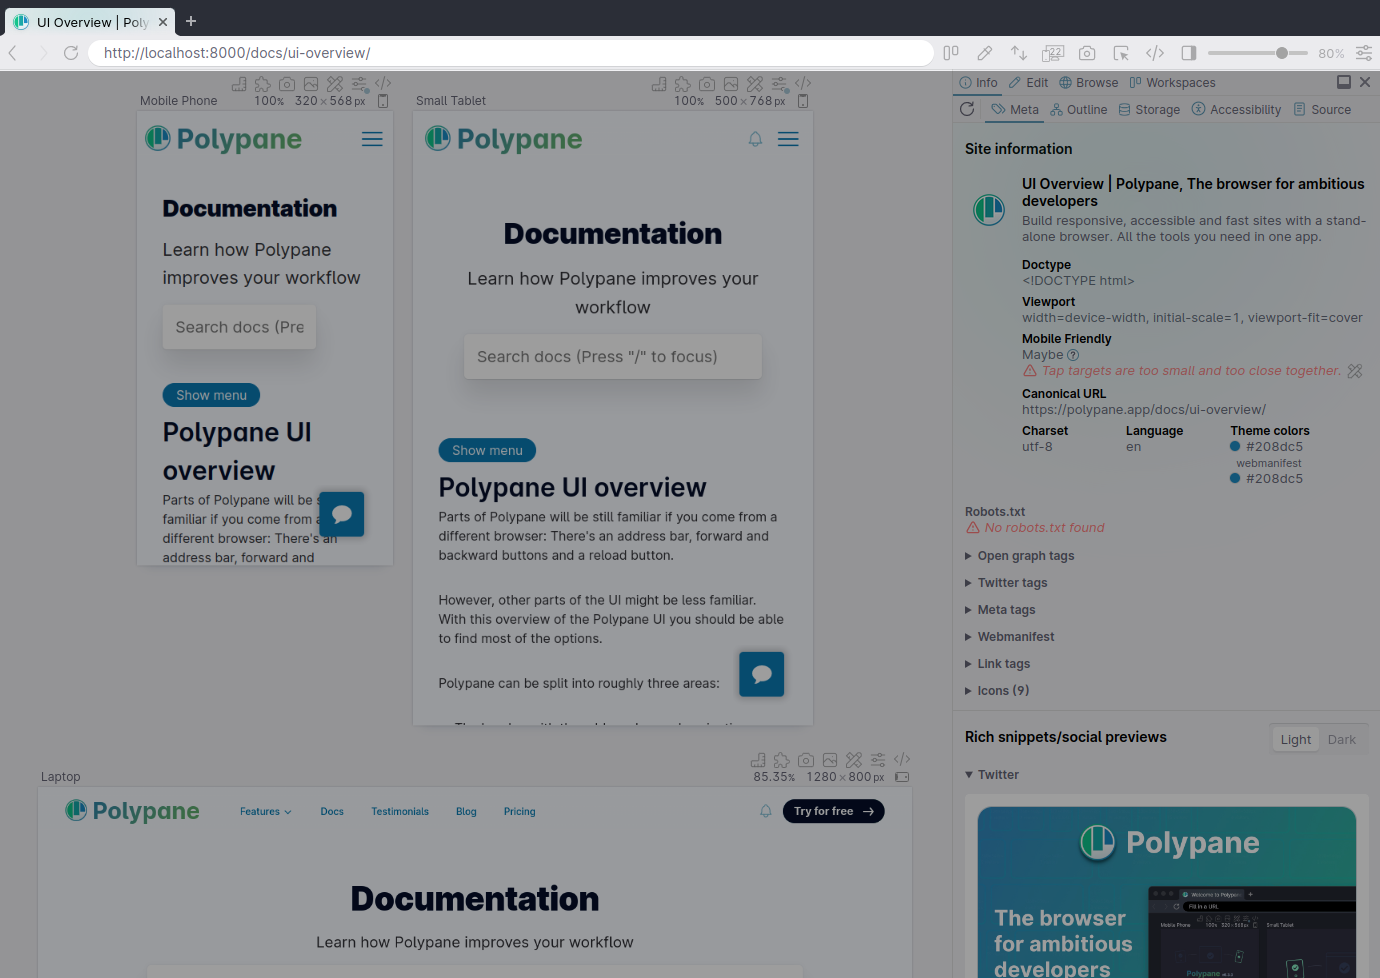
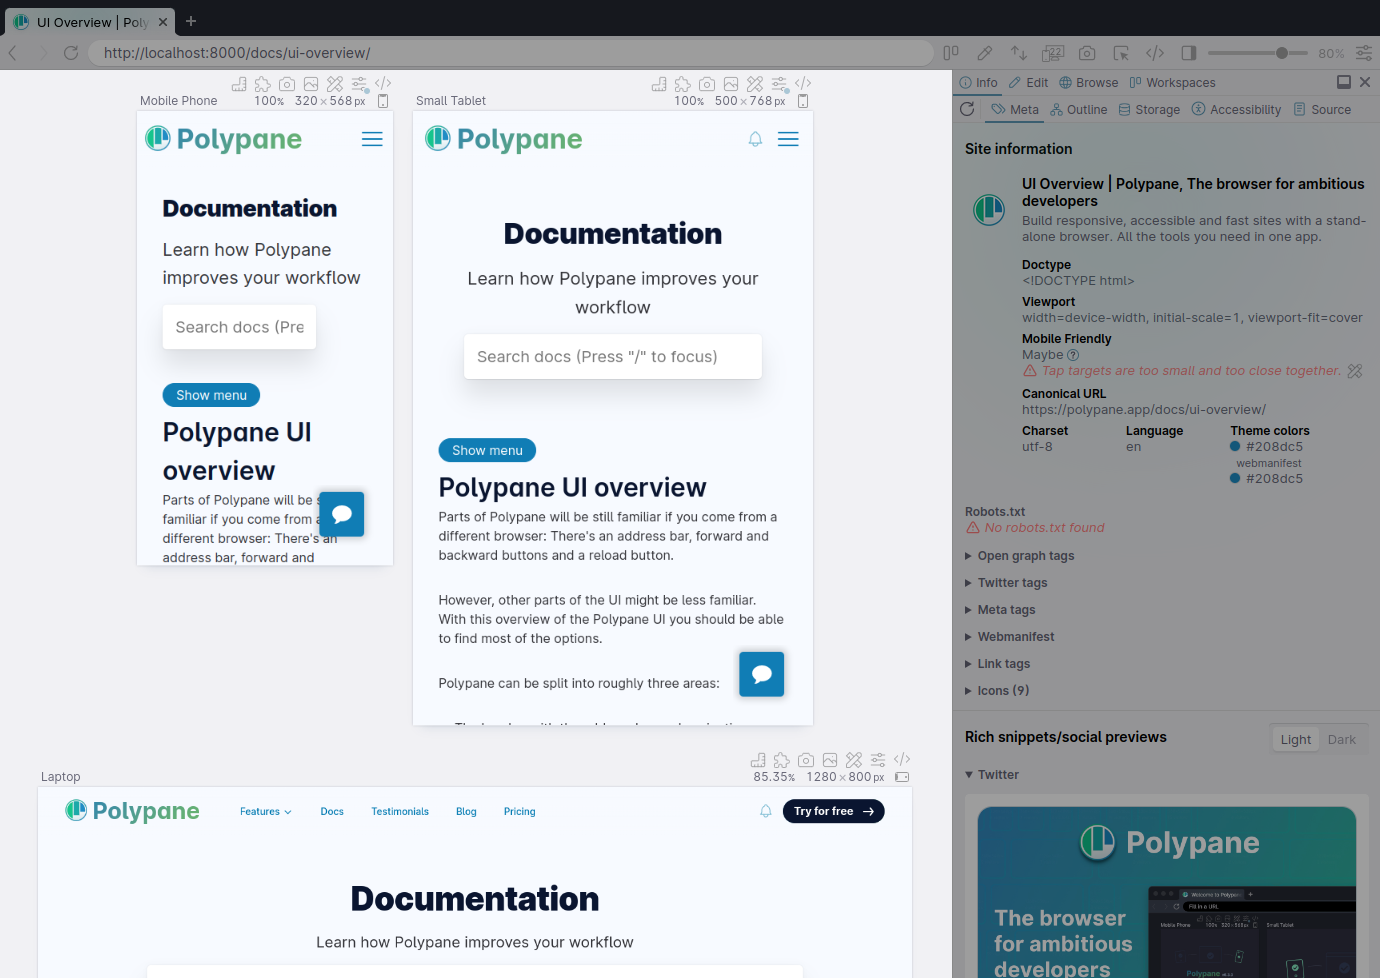
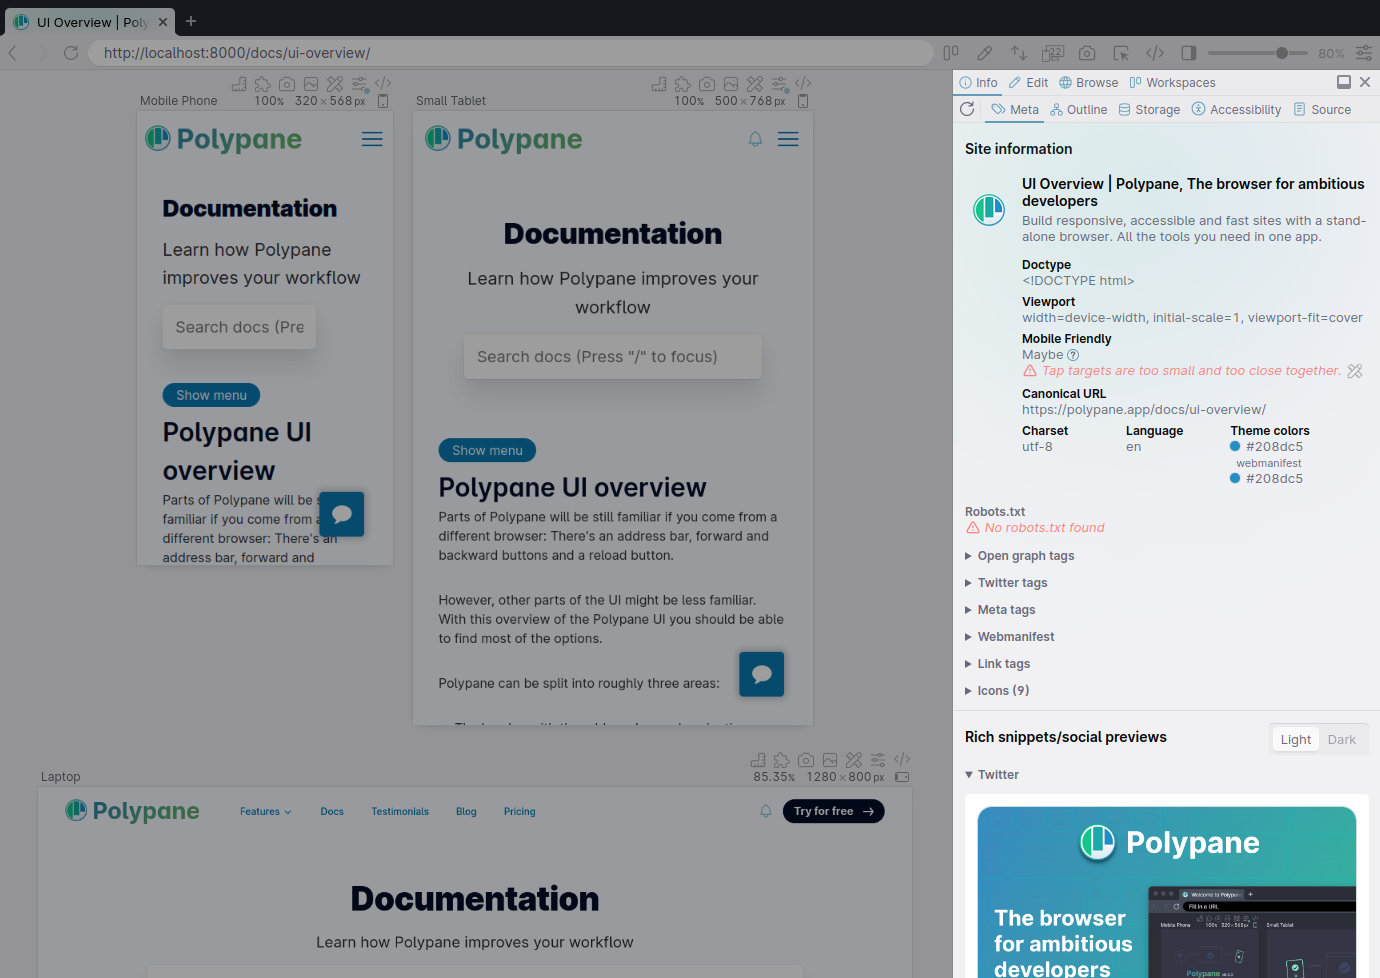
Polypane UI overview
Parts of Polypane will be still familiar if you come from a different browser: There's an address bar, forward and backward buttons and a reload button.
However, other parts of the UI might be less familiar. With this overview of the Polypane UI you should be able to find most of the options.
Polypane can be split into roughly three areas:
- The header, with the address bar and navigation UI.
- The workspace, where your panes are.
- The panel, where the devtools are.
The header
The header is the similar to other browsers: there's a tab bar, an address bar, back and forward buttons and a reload button.
The navigational buttons will be clickable depending on if there is a forward or backward history, and right clicking will show you a list of previously visited pages.
The tab bar also shows the current project in the top left corner, and if there are any bookmarks in the current project, a bookmark icon is shown next to it.
The address bar
The address bar shows the URL for all panes in the current tab. Entering a new URL and pressing Enter navigates every pane at once. Press ⌘ L (or Alt+D / F6) to focus it from the keyboard.
When typing, Polypane shows suggestions based on your history, matching any fragment of the title or URL. We match per fragment, so you can type "po do" to match https://polypane.app/docs/, for example. Use the arrow keys to select a suggestion and press Enter to navigate to it, or click it with the mouse.
Press Esc to cancel and return to the current URL. If what you type can't be resolved to a URL, Polypane will search using your default search engine. For more on history, suggestions and search engines, see Browser features.
Hover over the address bar to show the share QR that lets you quickly open the current page on your mobile devices, or share your current tab overview with your team.
A few contextual indicators appear inside the address bar depending on the current state:
- A shield icon when web security is disabled for the current tab.
- An Offline badge when Polypane detects that you're offline.
- A magnifier icon (+ or −) after you zoom a page. Click it to adjust or reset the zoom level.
- The session name when the tab is using a non-default session. Click it to open the session manager.
- A JS or CSS badge when you have active snippets for the current tab. Click it to open the snippets panel.
- A portal icon when showing a local URL. Click it to open the portal settings and start sharing your local URL with connected devices and browsers.
If a project environment, Tab or URL has a color set, that color is shown in the address bar so you can quickly see which environment you are working in.
Reload
Clicking the Reload icon will reload the page, but if you right click it you get a few more options:
- Reload the CSS
- Hard reload
- Clear cookies and reload
You can also find quick options to scroll to the top or bottom of the page and access the Live and Auto reloading configuration from here, which lets you automate reloading pages based on changes you make in your code editor.
If you click the reload button again while the page is loading, loading will be stopped.
Tabs can be re-arranged by drag and drop, you can click the + button to add a new tab (or use ⌘ t). Right-clicking the + button lets you pick a new layout for the new tab.
The buttons in the header
To the right of the address bar is a set of icons that are unique to Polypane. Different layouts can show different buttons depending on whether or not they're available for that layout.
From left to right (in horizontal and vertical layouts):
- Change layout. Click it to choose between horizontal, vertical, focus and full mode.
- Session management. Switch to a different session.
- Color Picker. Pick colors from anywhere on the screen. Right click for the color picker UI.
- Scroll Sync. Toggle synchronized scrolling on and off. When off, a small
xis visible on the icon. Right click to manage other synchronisation features - Breakpoints. Clicking this button will creates panes for all breakpoins in the site CSS. Right click to find a list of all the breakpoints, and the 'simplified' breakpoints option.
- Screenshot. Makes a overview screenshot of all panes together.
- Inspect element. Click to inspect elements in all panes. Right click to inspect with pane-specific devtools. (this setting is remembered.)
- Open devtools. Click to toggle the developer tools. Right click to open the Browser extensions manager.
- Open Panel. Click to open the side panel, where you can find Meta information, social media previews, snippets, the browse panel and an overview of your saved workspaces.
- Global zoom lets you zoom all your panes at once. The percentage can be clicked and manually changed as well. By double clicking the percentage you can zoom to 100% or zoom to fit.
- Browser Extensions Click to toggle showing your browser extensions or right-click to open the extensions manager.
- App settings contains various global options to turn on and off, like web vitals and console messages, as well as performance options. You can also open this with the shortcut ⌘ ,.
In the Focus and Full layouts the Pane-specific options are also added to the header UI.
The Workspace
The workspace is where all your panes are shown. To learn more about the different layouts availabl for the workspace, read the layout section of our documentation.
To learn more about panes and their UI, read the Intro to panes.
The Panel
The panel is where you find some of the more advanced tools that Polypane offers, like the unified console, the combined element inspector and the meta information panel.
The panel can be opened by clicking the icon in the header or by pressing ⇧ ⌘ p and can be docked to the right, left or bottom of the window, or in its own window.
For a full overview, read the intro to panel
Have a question about Polypane?
Reach out via (real human) chat, Slack or our contact form:
Contact SupportBuild your next project with Polypane
- Use all features on all plans
- On Mac, Windows and Linux
- 14-day free trial – no credit card needed