Documentation
Learn how Polypane improves your workflow
Devtools Panel
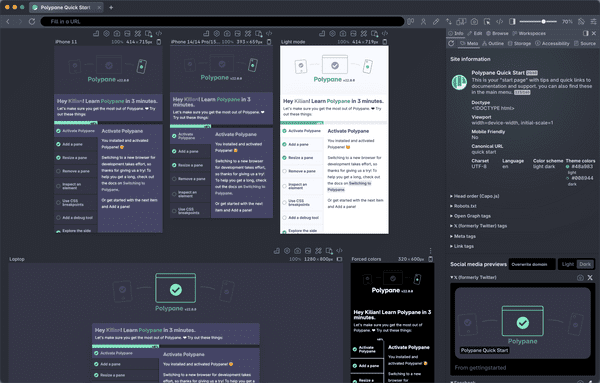
The Devtools tab in the Edit panel contains the Chromium devtools. These devtools only work for a single pane at a time, which you can select from the dropdown located at the top of the panel. You can also open the Chromium devtools for a specific pane by clicking the icon above the pane or right click anywhere in a pane and select "Inspect element (in devtools)" to inspect the element under the cursor.
When you have a single pane visible, opening the devtools panel will start its devtools automatically.
From there, you can use Chromium devtools for the selected pane, as well as use any of the devtools extensions you have installed.
Using the Chromium developer tools by default
Right click the Inspect element icon in the header to switch it to always inspect elements with the Chromium devtools. When this is active, the icon will show a small devtools icon alongside it. Now inspecting from the address bar or with the ⇧ ⌘ C shortcut will default to using the chrome developer tools.
The Polypane Peek feature also works with the Chromium devtools so you can still press alt to inspect.
Undocking the Chromium devtools
If you prefer the devtools to be undocked, you can uncheck "Docked devtools" in the global Edit menu (the one next to the File menu).
Reloading devtools
Sometimes the Chromium devtools lose their connection to your pane, which will show itself as the elements panel no longer showing the correct DOM structure.
When this happens, reloading the devtools reestablishes the connection. Click the reload button in the devtools toolbar to do this.
Devtools extensions
You can install devtools extensions like the React or Vue.js DevTools. Learn about them here: Browser Extensions.
Have a question about Polypane?
Reach out via (real human) chat, Slack or our contact form:
Contact SupportBuild your next project with Polypane
- Use all features on all plans
- On Mac, Windows and Linux
- 14-day free trial – no credit card needed
