Documentation
Learn how Polypane improves your workflow
Accessibility audit workflow
Polypane has a wide range of built-in accessibility tools. This walkthrough shows how to combine them for a thorough accessibility audit in one pass.
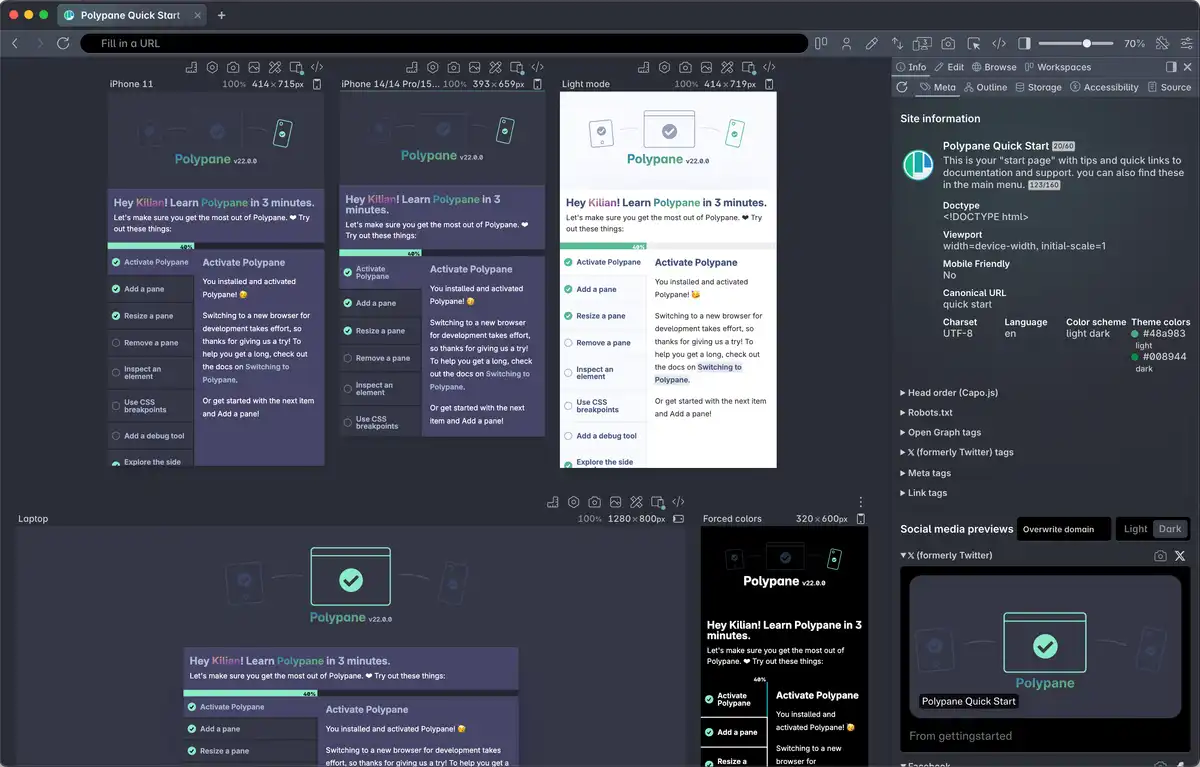
1. Set up your viewports
Open your page and create panes for the breakpoints you want to test. At minimum, use a mobile and a desktop viewport. Click the Breakpoints button to generate panes from the breakpoints defined in your CSS automatically, or add panes manually at custom widths.
Add additional panes for any specific conditions you want to test, like a dark/light mode or a specific tablet size.
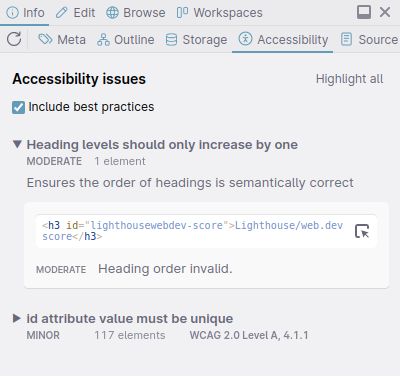
2. Run the accessibility panel audit
Open the panel and click the Accessibility tab. Polypane runs a WCAG 2.2 audit and lists issues grouped by severity. The results match what Lighthouse and web.dev report, so fixing these improves your scores there too.
Enable "Include best practices" to also surface issues that are not outright WCAG failures but can still affect users.
For each issue, hover the HTML snippet to scroll to and highlight the matching element in all panes. Click the inspect icon to jump to it in the Elements panel so you can edit and re-run the audit without leaving Polypane.
More on the accessibility panel.
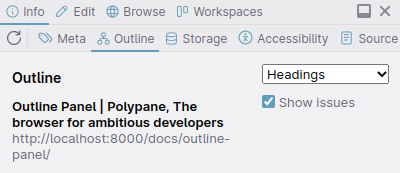
3. Check document structure
Open the Outline tab in the panel. This shows the heading hierarchy, landmark regions, image alt text, link text and the full tab order of the page. A clear heading structure and proper landmark regions are fundamental for screen reader users.
4. Test keyboard navigation and focus order
Synced interactions means tabbing through a page in one pane tabs through it in every other pane at the same time. This lets you see focus states at all breakpoints in a single pass.
Use the Focus order view in the Outline panel to see the complete tab sequence rendered visually. This makes it easy to spot focus traps or illogical sequences.
If the pages you need to check contain Forms, you can autofill them to quickly verify their behavior, while use the form outline to check for missing labels or other issues.
5. Check color contrast and color vision
Open Debug tools and enable the contrast checker overlay. This highlights elements whose foreground/background contrast does not meet WCAG AA. Enable one of the color blindness simulations in the same panel to check contrast under different color vision conditions.
The Color picker also reports the contrast ratio when you hover over the page, so you can spot-check specific combinations.
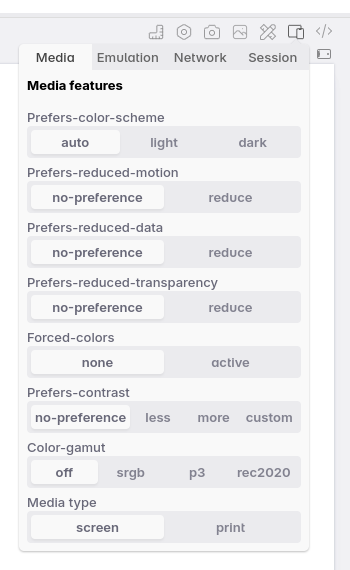
6. Simulate user preferences
Use the Emulation settings on each pane to test under different user preferences:
prefers-reduced-motionto stop animations from playingprefers-contrast: moreto force high contrast modeforced-colorsto simulate Windows High Contrast Modeprefers-color-scheme: darkto check your dark mode styles
Because emulation is per-pane, you can set the default and a simulated preference side by side and compare them without switching back and forth.
7. Screenshot your findings
Use overview screenshots to capture all panes at once as a single image. Screenshots preserve any active debug tool overlays, so the contrast checker highlights or focus indicators show up in the output. Attach these to issues or share them with your team.

See also
- Accessibility overview for a full list of accessibility features in Polypane
- Accessibility panel for details on the WCAG audit
- Outline panel for heading, landmark and focus order views
- Debug tools for contrast checking and color vision simulations
- Emulation for user preference media queries
From the blog
- Find and fix accessibility issues with Polypane: a walkthrough of common accessibility issues and how to audit and fix them
- The WebAIM Million 2025: Solving the most common issues: the most frequently found accessibility failures and how to fix them with Polypane
- Developing for color blindness with Polypane: how to use color blindness simulations to make your site work for more people
- Forced colors explained: A practical guide: how forced colors mode works and how to test your site with it
Have a question about Polypane?
Reach out via (real human) chat, Slack or our contact form:
Contact SupportBuild your next project with Polypane
- Use all features on all plans
- On Mac, Windows and Linux
- 14-day free trial – no credit card needed